
Has the Super City been a success?
Depends who you ask.
For me I have three considerations to measure whether Super Auckland has been a success relative to its predecessors of pre 2010. Those considerations being:
- Transport
- Economics (does include planning)
- Political stability
All three I give a tick overall so to me the Super City is a success although Auckland is not perfect and we still have a lot of work to do (example: Jobs Within 30 Minutes using Public Transport. Auckland Has a Lot of Work to Do #AKLPols)
I might give a full breakdown of what is going well and what isn’t for me as a ratepayer and voter living in Auckland sometime next week.
But for now this from Our Auckland:
Auckland scorecard up 19 per cent

Five years on from the birth of the new Auckland, the latest Auckland Scorecard has revealed that Aucklanders are enjoying better public transport, higher incomes, are better educated and have cleaner beaches.
The annual scorecard was introduced by Mayor Len Brown in 2011 and shows the progress Auckland is making towards the mayor’s vision of becoming the world’s most liveable city.
The scorecard enables Auckland to gauge its performance across a broad range of measures and complements other internationally recognised measures of liveability in cities. At the mayor’s request, there are liveability categories across economy, transport, communities and environment, covering 19 measures.

From a base index of 100 points, the latest index has lifted by 19 points since the birth of the united Auckland.
Len Brown says the latest scorecard shows a strong rate of improvement, with the work being done in areas such as public transport paying noticeable dividends.
Special housing areas help address housing challenge
While there are improvements in most categories, housing affordability remains the most challenging.
“There are obviously ongoing challenges with housing, but the special housing area work we are doing with the government is an example of the improvements that are starting to come through,” says the mayor.
“However, the trends are definitely swinging in the right direction, with new housing consents more than doubling since the creation of the new Auckland Council.”
He said that the Unitary Plan, Auckland Plan and the Economic Development Strategy were also important steps.
Improvements to public transport, youth employment
“I’m especially pleased that the public transport patronage growth is reflected in the improvement in the category of fixing transport in Auckland.
“It’s great to see progress in jobs, especially for young people, which is also a reflection of the youth pledges Auckland employers have been signing.
“When I became mayor, one of the big complaints was about the graffiti on buildings strewn throughout the region and it’s great to see the big progress in tackling that anti-social issue.”
Major events bring dividends
The mayor says economic measures such as the growth in visitor nights showed the council’s major events strategy paying off by attracting events such as the Dick Smith NRL Auckland Nines, the ITM 500 V8 Supercars and the recently announced new Auckland City Limits Music Festival.
Auckland continues to be recognised in internationally accepted surveys of liveable cities. In the most recent, The Economist Intelligence Unit (EIU) rated Auckland as number nine in its report on 140 cities. It moved up from number 10.
In 19 categories of the latest scorecard, there have been improvements in all but four categories.

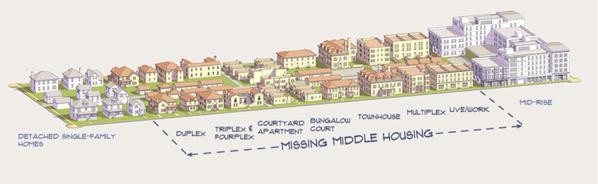
Source: Brent Toderian
From the Office of the Mayor Len Brown:
Auckland scorecard up 19% in first five years
Five years on from the birth of the new Auckland, the latest Auckland Scorecard has revealed that Aucklanders are enjoying better public transport, higher incomes, are better educated and have cleaner beaches.
The annual scorecard was introduced by Mayor Len Brown in 2011 and shows the progress Auckland is making towards the Mayor’s vision of becoming the world’s most liveable city.
The scorecard enables Auckland to gauge its performance across a broad range of measures and complements other internationally recognised measures of liveability in cities. At the Mayor’s request, there are liveability categories across economy, transport, communities and environment, covering 19 measures.
While there are improvements in most categories, housing affordability remains the most challenging.
From a base index of 100 points, the latest index has lifted by 19 points since the birth of the united Auckland.
Len Brown says the latest scorecard shows a strong rate of improvement with the work being done in areas such as public transport paying noticeable dividends.
“There are obviously on-going challenges with housing but the Special Housing Area work we are doing with the Government is an example of the improvements that are starting to come through.
However the trends are definitely swinging in the right direction with new housing consents more than doubling since the creation of the new Auckland Council.”
He said that the Unitary Plan, Auckland Plan and the Economic Development Strategy were also important steps we are taking to address this.
“I’m especially pleased that the public transport patronage growth is reflected in the improvement in the category of fixing transport in Auckland.
“It’s great to see progress in jobs, especially for young people, which is also a reflection of the youth pledges Auckland employers have been signing
“When I became Mayor, one of the big complaints was about the graffiti on buildings strewn throughout the region and it’s great to see the big progress in tackling that anti-social issue.
Len Brown says economic measures such as the growth in visitor nights showed the council’s major events strategy paying off by attracting events such as the Dick Smith NRL Auckland Nines, the ITM 500 V8 Supercars and the recently announced new Auckland City Limits Music Festival.
Auckland continues to be recognised in internationally accepted surveys of liveable cities. In the most recent, The Economist Intelligence Unit (EIU) rated Auckland as number nine in its report on 140 cities. It moved up from number 10.
In 19 categories of the latest scorecard, there have been improvements in all but four categories.

Source: Auckland Council
Further Information
Theme – STRONG COMMUNITIES
Educational Achievement – Percentage achieving NCEA Level 1 Literacy and Numeracy
Result – 11% improvement
This is considered a minimum level of literacy and is internationally comparable under the OECD PISA system. Auckland’s performance has improved over the 5 year period from 2009-14. (Source: Ministry of Education)
Youth Unemployment – Youth Not in Employment, Education or Training (NEET)
Result – 17% improvement
This is an indicator of “at risk youth”. It measures the percentage of 15 to 24 year olds who are not in education, employment, or training. (Source: Statistics NZ)
Crime – Reported crime per 100,000 people
Result – 21% improvement
There has been a substantial and steady reduction in crimes reported to Auckland’s three police districts since 2010. (Source: NZ Police)
Graffiti – Graffiti complaints received
Result – 26% improvement
This measures the number of incidents of graffiti reported to Auckland Council and removed by Councils contractors each year. Rapid removal of graffiti is intended to discourage repeat offers and reduce the frequency of this anti-social behaviour. Note data has only been available for the three years from July 2012 to June 2015. (Source: Auckland Council)
Housing affordability – Housing affordability index
Result – 23% deterioration
This compares Auckland’s average household income/average house price ratio with the national average (set at 100). Auckland’s housing affordability has deteriorated compared with the national average. (Source: Massey University)
Housing supply – Number of new dwelling consents
Result – 145% improvement
Measures the number of new dwelling consents lodged with Auckland Council each year. The logic is that there is a very close relationship between consents lodged and dwelling completions. Consents lodged have more than doubled since 2010. (Source: Auckland Council)
Theme – FIXING TRANSPORT
Public transport – Measurement of public transport trips
Result – 20% improvement (rail up 43%, bus up 16%, ferry up 15%)
Reducing congestion on the region‘s roads, facilitating more concentrated employment in major employment areas and reducing the per-capita investment in required transport infrastructure, s greater uptake of public transport is needed. Public transport patronage growth is well ahead of forecasts. (Source: Auckland Transport)
[Still waiting: How One South Link Improves the Job Catchment for Southern Auckland #AKLPols]
Expenditure on Cycleways –Investment on cycleways
Result – 49% improvement
Local and national cycling experts have repeatedly told Auckland Council that to increase the number of commuter, school children and recreational cyclists, investment in safe dedicated cycleways is needed. Cycleway investment has improved markedly since 2010 and is budgeted to significantly increase further. (Source: Auckland Transport)
Congestion – Time losses to morning peak congestion
Result – 10% improvement
Time lost to congestion lowers economic productivity and the quality of life of road users. It is the primary factor holding Auckland back from achieving even higher scores in international liveability surveys. Various traffic management investments have seen congestion drop in Auckland over recent years. Population and economic growth, however, is likely to make such reductions unsustainable. (Source: NZTA)
Expenditure on Roads – Operating expenditure on local roads
Result – 27% improvement
Operating expenditure includes the costs of operating and maintaining the local (non-state highway) road network, as well as the costs of borrowing for new infrastructure. Auckland requires investment in an efficient road-based transport network for growing freight and people movements, as well as a corridor for utilities. (Source: Auckland Council)
Theme – OUR ECONOMY
GDP – GDP per Capita
Result – 14% improvement
GDP is a measure of the value of economic activity (production or expenditure) within a set of borders within a period of time. It is a guide to whether an economy is growing or not. GDP per capita is an important measure for an economy that is also experiencing population change. For example, if population growth is higher than GDP growth, it suggests that production or expenditure per person is shrinking. Auckland’s GPD per capita is growing. (Source: Infometrics)
Jobs – Total Employment
Result – 12% improvement
Employment data indicates whether Auckland is creating jobs fast enough to deal with population growth and the resulting number of people entering the workforce. If employment growth is not sufficiently strong, unemployment will rise. (Source: Statistics NZ)
Incomes – Average Weekly Personal Income
Result – 10% improvement
There is a range of income statistics. Weekly personal income is a measure that is measured across all income sources, people easily relate to it and it is readily available from Statistics NZ. (Source: Statistics NZ)
Accommodation – Total Guest Nights
Result – 20% improvement
Commercial accommodation provides a measure of both the health of the visitor/tourism economy and the degree to which Auckland business connects to the rest of New Zealand and the world. Growth in guest nights, high occupancy rates and consents for large hotel investments suggest this part of Auckland’s economy is doing very well. (Source: Statistics NZ)
Theme – OUR ENVIRONMENT
Greenhouse Gas Emissions – Diesel and Petrol Sales
Result – 1% deterioration
Diesel and petrol sales are used as a proxy for overall greenhouse gas emissions and represent a source of such emissions over which Council has influence through its transport investments. An example is the recent investment in electric trains. (Source: Local Authority Fuel Tax Data)
Marine Water Quality – Marine Areas with Fair to Excellent Water Quality
Result – 4% improvement
Auckland Council carries out regular testing of beaches and marine areas around the Auckland Region. This measure shows the % of tested areas showing fair to excellent water quality over multiple tests. (Source: Auckland Council)
Freshwater Quality – Ecological Scores (MCI- Macroinvertebrate Community Index)
Result – 21% deterioration
Freshwater streams with Fair to Excellent Ecological Scores (MCI- Macroinvertebrate Community Index)
Like marine areas, the Region’s streams are also frequently tested for organic and inorganic contaminants. (Source: Auckland Council)
Air Quality – Average Concentration of Soot-Like Particles Under 10µ (micrograms per m3)
Result – 4% deterioration
Regular sampling of air quality is performed around the region, particularly urban areas. Soot-like particle measures have been chosen because they are a particular health risk and as a proxy for a broader range of air born pollutants. (Source: Auckland Council)
………
Air quality is down in the scores and we have urban economists wanting to flip our golf courses into (public) housing? I think the air quality slippage shows why those courses are still needed to the point they should be flipped to urban forests to help IMPROVE our air quality (see: The Case for Golf Courses, well actually Case for Urban Forests #AKLPols)
So Auckland is getting there but we still have a lot of work to do.

