
Time to start reclaiming the streets for the people
Executive Summary
This document synthesizes the core principles and strategies for designing safer urban streets by focusing on speed management. The central argument is that road safety is a global public health crisis, with approximately 1.19 million people killed in traffic crashes annually, and that vehicle speed is the primary contributing factor. Traditional street design, which has long prioritized vehicle capacity and flow, has inadvertently created dangerous environments by encouraging unsafe speeds, particularly for vulnerable road users such as pedestrians, cyclists, and motorcyclists, who account for more than half of all traffic fatalities.
The most effective and sustainable solution is a paradigm shift towards a people-centric, design-based approach. Rather than relying solely on signage and enforcement, this methodology uses physical street design to make safer speeds a natural, self-enforcing outcome for drivers. Key strategies include rightsizing streets by narrowing or repurposing travel lanes, re-engineering intersection geometry to reduce turning speeds, and implementing traffic calming measures.
This approach operates at multiple scales, from network-wide circulation plans that manage through-traffic (e.g., Barcelona’s Superblocks, London’s Low Traffic Neighborhoods) to corridor-level redesigns and site-specific interventions using a toolbox of vertical and horizontal deflection tools. The implementation of these strategies yields significant co-benefits beyond safety, including reduced carbon emissions, lower noise pollution, increased physical activity, enhanced public spaces, and stronger local economies. Case studies from around the world, such as Bologna’s city-wide 30 km/h limit which led to a 50% reduction in fatalities, provide compelling evidence of the life-saving impact of designing for safe speeds.
Why are our streets failing?
1. The Imperative for Speed Management: A Global Public Health Crisis
Traffic incidents constitute a significant and preventable global health crisis. Street design is identified as a powerful tool to manage the primary factor in this crisis: vehicle speed.
1.1 The Scale of the Crisis
- Global Fatalities: An estimated 1.19 million people were killed in traffic crashes worldwide in 2021.
- Leading Cause of Death: Road traffic crashes are a leading cause of death globally for children and young adults (ages 5-29).
- Disproportionate Burden: Vulnerable road users—pedestrians, cyclists, and motorcyclists—represent more than half of all traffic-related fatalities annually.
- Economic Disparity: The crisis is unequally distributed. 92% of the world’s road fatalities occur in low- and middle-income countries, which have traffic fatality rates nearly two to three times higher than high-income countries.
- Economic Impact: Beyond healthcare costs, traffic deaths and injuries reduce economic productivity. A 10% reduction in traffic deaths is estimated to raise real GDP per capita by 3.6% over a 24-year period.

1.2 The Central Role of Speed
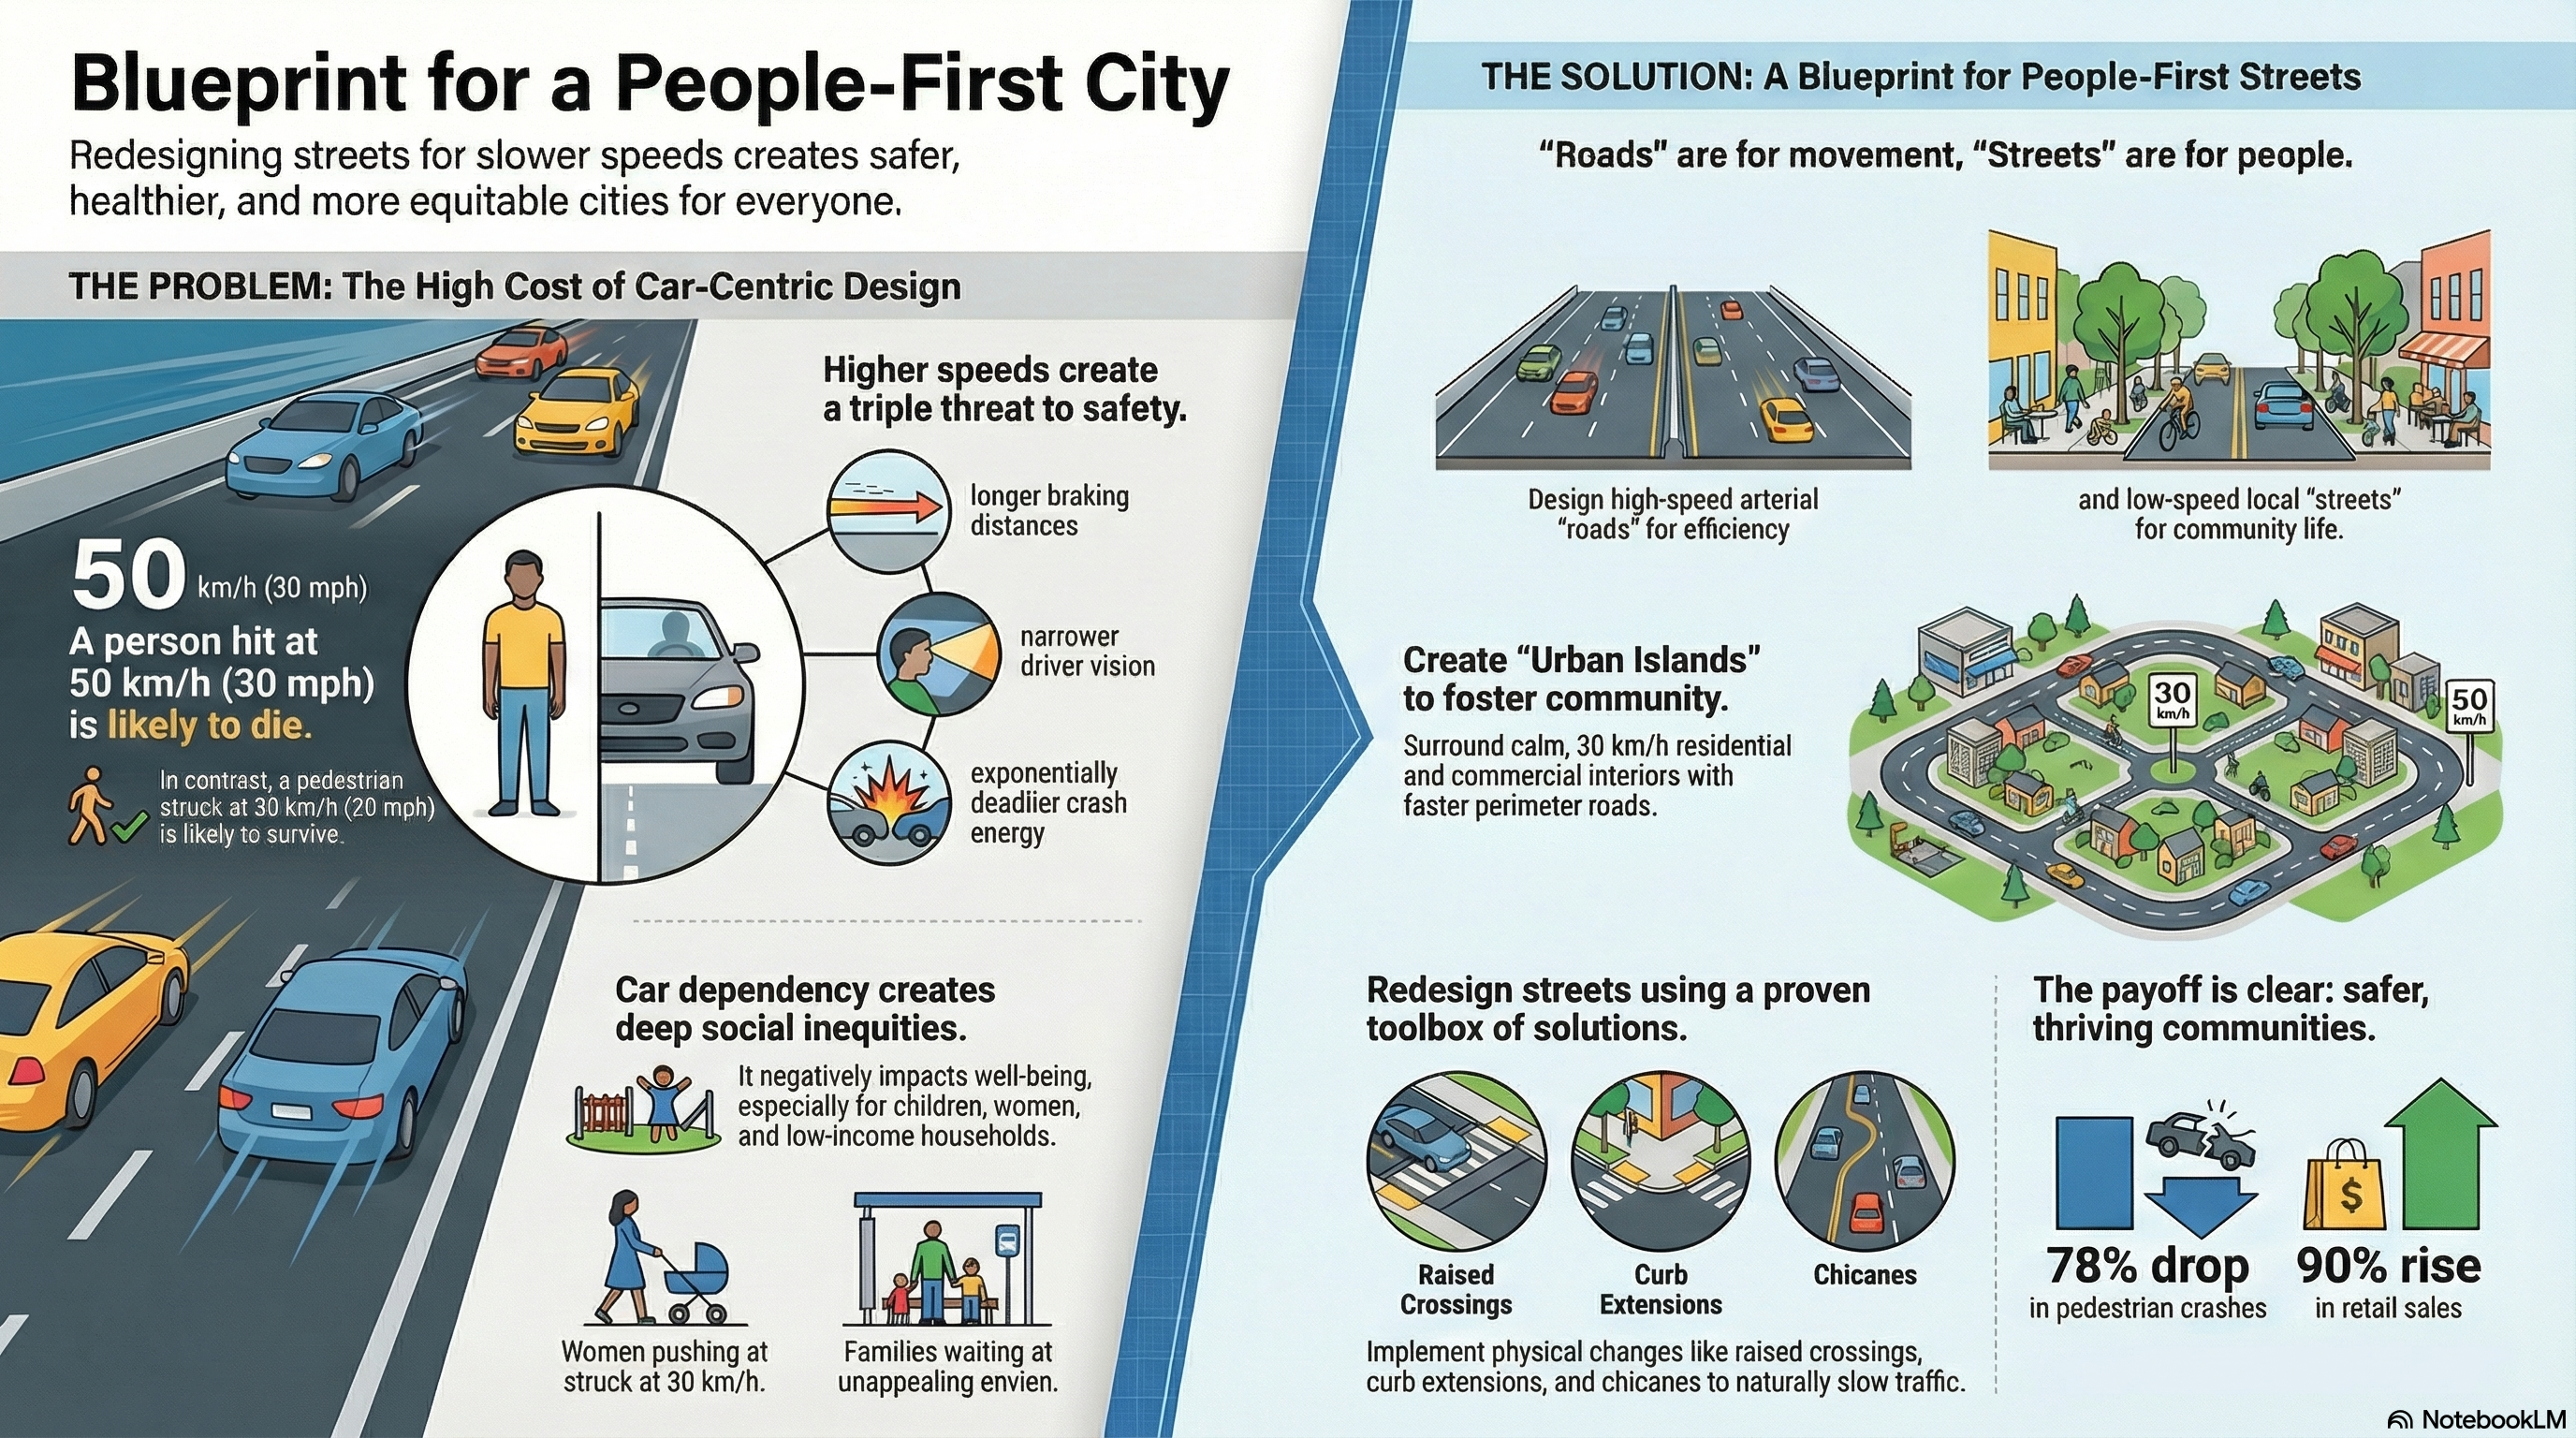
Speed is a key factor in both the likelihood and severity of traffic crashes, listed as the primary cause in over half of crashes globally. The relationship between impact speed and pedestrian fatality is stark:
A person hit by a car at 50 km/h is eight times more likely to die than a person hit by a car at 30 km/h.
This effect is believed to be even more extreme in low- and medium-income countries due to factors like vehicle types and emergency response times.
1.3 The Failure of Car-Centric Design
Historically, streets have been designed to maximize the volume and speed of motor vehicles, leading to dangerous conditions.
- Unintended Consequences: Excessively wide roadways and intersections, intended to increase capacity, incentivize unsafe speeds.
- Induced Demand: Expanding road capacity for private vehicles often creates induced demand, resulting in congestion during peak hours while providing opportunities for dangerous speeding during off-peak times.
- Neglect of Vulnerable Users: This design philosophy has created unpleasant and dangerous conditions for pedestrians and cyclists, who often lack safe, dedicated infrastructure.
2. Core Philosophy: A People-Centric, Design-Based Approach
The guide advocates for a fundamental shift in street design priorities, moving from a vehicle-centric model to one that prioritizes human safety, health, and livability.
2.1 Key Principles
- Self-Enforcing Design: The most effective approach is to use street design to physically restrict speeding and subconsciously communicate appropriate driving speeds. This is more effective than relying on signage, which can feel inadequate, or automated enforcement, which can feel arbitrary when the environment encourages higher speeds.
- Safe System Approach: This methodology emphasizes speed management measures as critical to protecting vulnerable road users and systematically eliminating fatalities and serious injuries.
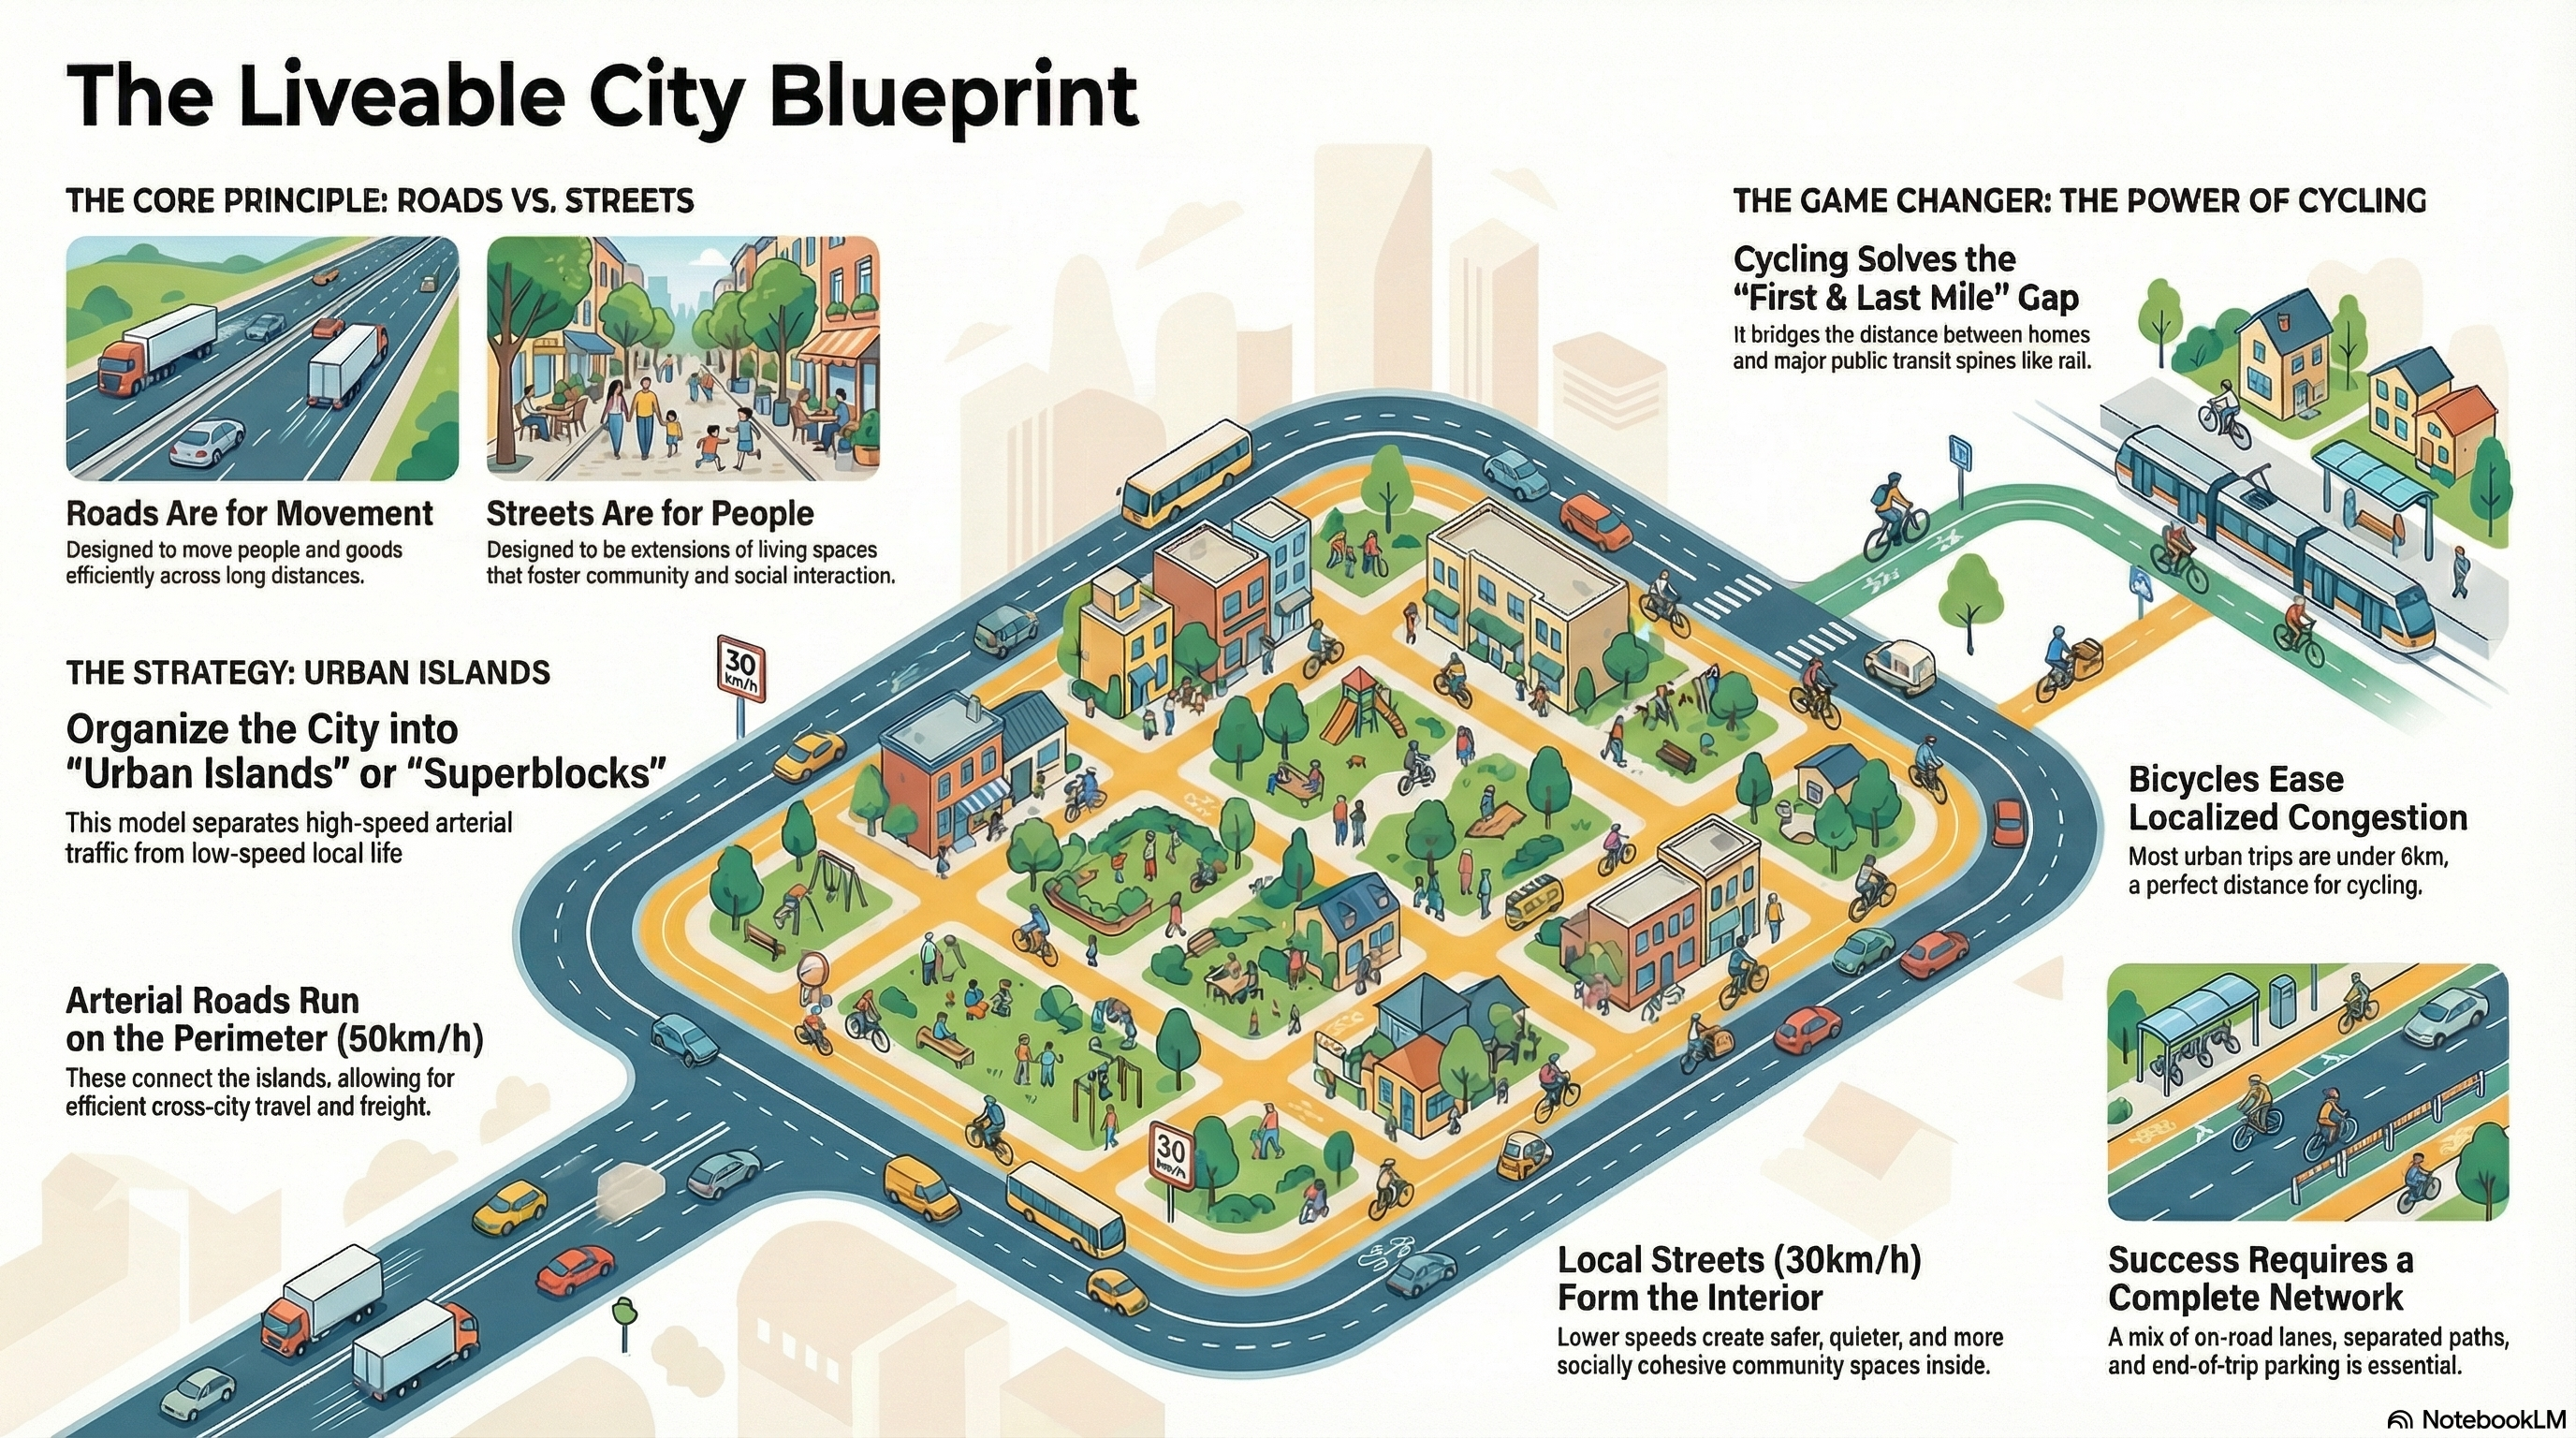
- Streets as Multidimensional Public Spaces: Streets should be designed not just for movement but also as quality public spaces that support social interaction, cultural expression, and local economies. They should support healthy environments through active transportation and green infrastructure.
- Prioritizing Sustainable Modes: Design should create safe, efficient, and comfortable experiences for pedestrians, cyclists, and transit riders to reduce dependency on private motor vehicles.
2.2 Legislative and Policy Frameworks
Successful speed management requires a comprehensive approach, from national legislation to city-level policies.
- Julián Esteban Law (Colombia): Passed in 2022, this law set new national speed limits of 50 km/h in urban areas and 30 km/h in school and residential zones.
- Bologna Città 30 (Italy): In 2024, Bologna became the first major Italian city to implement a default 30 km/h speed limit. In its first year, the policy led to a 13% reduction in all crashes, a 30% decrease in serious injuries, and a 50% drop in fatalities.
3. Strategic Framework for Safe Speed Networks
Effective speed management requires thinking beyond individual streets to consider the entire urban network. The framework organizes strategies at the network, corridor, and street levels.
3.1 Network-Level Strategies
The goal is to manage traffic volumes and discourage through-traffic in residential and commercial areas, making these zones safer and more livable.
- Filtered Permeability: This strategy enhances local streets by restricting through-traffic for motor vehicles while maintaining full connectivity for pedestrians and cyclists.
- Circulation Plans: These plans use volume and access management techniques to discourage driving into city centers, making walking, cycling, and transit more appealing. The Ghent Circulation Plan is a key example.
- Low Traffic Neighborhoods (LTNs): As implemented in London, LTNs use filters like planters, bollards, and cameras to restrict through-traffic, creating quieter, safer local streets.
- Superblocks (Superilles): Barcelona’s model reorganizes the street grid, dedicating boundary streets for through-traffic while converting inner streets into low-speed, multi-use public spaces with drastically reduced vehicle presence.
3.2 Corridor and Street Design Parameters
Designing for safe speeds requires careful consideration of the specific context and function of each street.
- Context-Sensitive Speeds: A single corridor may traverse different contexts (e.g., low-density residential, dense commercial), requiring its design and target speed to adapt accordingly.
- Design vs. Control Vehicle: A critical concept to prevent over-designing streets.
- Design Vehicle: The least maneuverable vehicle that will routinely use the street (e.g., a city bus or small delivery truck).
- Control Vehicle: The least maneuverable vehicle that will ever use a street, but potentially at very low speeds or with multipoint turns (e.g., a large fire truck). Streets should be designed for the routine design vehicle, not the occasional control vehicle, to avoid overly wide roads and high-speed turns.
4. The Toolbox for Safer Street Design
A range of physical tools can be deployed to manage speed and reallocate street space. These tools are categorized into rightsizing strategies, vertical deflection, horizontal geometry, and operational measures.
4.1 Rightsizing and Repurposing Space
This foundational strategy involves reclaiming space from oversized vehicle lanes to enhance safety and provide amenities for other modes. Oversized lanes are a proven cause of higher speeds and do not increase motor vehicle capacity.
| Lane Type | Recommended Width | Notes |
| Mixed Traffic Lanes | 2.7 m | For multilane streets shared by cars and two/three-wheelers. |
| Lanes with Transit | 3.0 m | To accommodate occasional full-size transit vehicles. |
| Lanes on Truck/Transit Routes | One 3.3 m lane per direction | Should be the outside (curbside) lane. |
| Turning Lanes | 3.0 m or narrower | |
| Parallel Parking Lanes | 1.8–2.5 m | |
| Low-Volume Two-Way Streets | 4.75–5.5 m (total roadway) | For streets where large vehicles are rare. Requires drivers to slow to pass. |
4.2 Vertical Deflection Tools
These tools create localized elevation changes that require motorists to reduce speed for comfort.
| Tool | Target Speeds | Placement | Key Function |
| Raised Crossings/Plateaus | 10–40 km/h | Mid-block / Intersection | Provides safe, accessible crossings; slows vehicles. |
| Raised Intersections | 10–40 km/h | Intersection | Calms speeds for all approaching vehicles; improves pedestrian safety. |
| Speed Humps | 10–50 km/h | Mid-block / Approach | Slows vehicles. Sinusoidal profile is gentler than a speed bump. |
| Speed Bumps | 10–30 km/h | Mid-block / Approach | Sharper profile for lower target speeds. Not for pedestrian desire lines. |
| Continuous Sidewalks | 10–30 km/h (side street) | Intersection | Extends the sidewalk across a minor street, prioritizing pedestrians. |
4.3 Horizontal Geometry Tools
These tools alter the vehicle’s path or narrow the roadway, requiring drivers to slow down to navigate.
| Tool | Target Speeds | Placement | Key Function |
| Rightsized Corner Radii | 5–15 km/h (turning) | Intersection | Reduces turning speeds and shortens pedestrian crossing distances. |
| Pinchpoints (Bulb-outs) | 10–50 km/h | Mid-block / Approach | Narrows the roadway, shortens crossings, creates space for amenities. |
| Chicanes / Lane Shifts | 10–40 km/h | Mid-block / Approach | Creates a lateral shift in the vehicle path, forcing speed reduction. |
| Central Islands | 10–50 km/h | Mid-block / Intersection | Narrows lanes and provides a refuge for pedestrians. |
| Slip Lane Removal | 10–30 km/h (turning) | Intersection | Eliminates high-speed turning channels, reclaiming space for pedestrians. |
4.4 Operational and Volume Management Tools
These tools use rules and technology to enforce speed and access restrictions.
- Modal Filters: Physical barriers (bollards, planters) or camera enforcement that restricts access for certain vehicle types (typically private cars) while allowing passage for pedestrians, cyclists, and sometimes transit or emergency vehicles.
- Signal Timing:
- Progression Speed: Timing consecutive signals for a lower progression speed (e.g., 20-30 km/h) discourages speeding between intersections.
- Pedestrian Lead Intervals: Gives pedestrians a head start to cross before vehicles get a green light.
- Automated Enforcement: Speed radars and cameras are proven to be effective. In New York City, installing speed radars in 750 school zones led to a 73% average reduction in speeding.
5. Implementation and Practical Considerations
Successful transformation requires a strategic implementation process that is both practical and politically astute.
- Phased Implementation: Projects can be developed over time to build support and test designs.
- Pop-Up (Hours/Days): Uses low-cost, temporary materials (cones, movable furniture) to demonstrate possibilities and generate excitement.
- Interim (Weeks/Months): Uses semi-durable materials (paint, fixed delineators, planters) to test designs over a longer period and collect data.
- Capital (Permanent): The ultimate goal, built with durable materials like concrete and asphalt, often informed by the results of interim phases.
- Material Choice: Materials communicate user priority. Highway-like asphalt signals vehicle dominance, while materials like cobblestones or pavers signal a pedestrian-oriented environment and create vibrations that naturally slow drivers.
- Community Engagement: Engaging with residents is critical to learn about local concerns and build political support for design proposals that align with community expectations.
- Adapting to Context: Design must account for local factors, including stormwater management, climate, construction practices, and cultural character, to ensure solutions are effective and sustainable.
6. Global Case Studies and Evidence of Impact
Cities around the world have demonstrated the success of designing for safer speeds.
| City / Project | Intervention Highlights | Documented Impact |
| Bologna, Italy | City-wide 30 km/h speed limit (“Città 30”) implemented in 2024. | 50% reduction in fatalities, 30% reduction in serious injuries, and 13% reduction in all crashes in the first year. |
| London, UK (Hackney LTNs) | Low Traffic Neighborhoods (LTNs) using modal filters to restrict through-traffic. | 56% traffic reduction inside LTNs, 5% reduction on boundary roads. Cycling increased by up to 57% on key routes. |
| Barcelona, Spain (Superblocks) | Reordering the street grid to create low-traffic inner zones and repurposing road space for public use. | Drastically reduced congestion, emissions, and risk to vulnerable road users within the superblocks. |
| New York City, USA (Queens Blvd) | Rightsizing from 10 to 8 lanes, adding protected bike lanes, expanding medians, redesigning slip lanes. | Transformed a notoriously dangerous arterial into a safer, multimodal corridor. |
| Bogotá, Colombia (San Felipe) | Street redesign with narrowed lanes, extended sidewalks, and protected crossings in a mixed-use area. | 46% reduction in crashes. 90% of children surveyed reported feeling safer. |
| Fortaleza, Brazil (Bonfim) | Intersection redesign, reducing crossing distances from 20m to 6m, adding modal filter plazas. | 86% reduction in pedestrians walking on the roadbed near a hospital; motorists driving over 30 km/h reduced from 16% to 2%. |

