
Some Key Points I got from the research paper

Note: Simulation Only. Not depicting Auckland
Earlier in the week I had pointed out that a Ministry of Transport commissioned research paper was released.
From the Ministry of Transport
Research on Auckland
Last updated on: 12/08/2014
Auckland’s size, growth and resulting congestion mean addressing the city’s transport issues is a key focus for the government.
From time to time, the Ministry commissions research to better understand Auckland’s transport issues.
Journey to Work Patterns in the Auckland Region
The results from the 2013 Census provide an opportunity to better understand Auckland’s journey to work patterns, and in particular, see what changes have occurred since the 2006 Census.
The Ministry of Transport commissioned Richard Paling Consulting Ltd to undertake an analysis of the journey to work data from the 2013 Census. The work covers:
- commuting patterns in Auckland from 2001 to 2013
- comparisons with commuting patterns of Australian cities
- journey to work patterns by sub-regional areas, local board areas, and census area units (CAU)
- commuting movements to selected key employment centres and from selected residential areas
- changes associated with investment in the rail corridor and Northern Busway
- commuting movements across the Waitemata Harbour
- impact of transport investment on land use.
The report, entitled Journey to Work Patterns in the Auckland Region, can be found below.
- Executive Summary [PDF, 4 MB]
- Journey to Work Patterns in the Auckland Region – main report [PDF, 8.2 MB]
Big city life? Challenges and trade-offs for Auckland city
In May 2014, NZIER released the report Big city life? Challenges and trade-offs for Auckland city(external link). The report aims to help inform debate on Auckland’s urban structure. It examines the impact of the city’s constrained geography and uses a simple economic model to show the effect on housing costs of improving transport infrastructure, lifting house construction productivity, and extending the urban limit.
Big city life? was funded by the Reserve Bank, the Treasury, the Ministry of Transport and NZIER’s public good programme, which supports research into areas of general interest to New Zealanders. You can read more on NZIER’s website(external link).
———————————————-
Source: http://www.transport.govt.nz/research/othertransportresearch/research-on-auckland/
I have had a read of both the Executive Summary, and the main document in itself. I will be running a series of blog posts over the next wee while in particular to these sections of the report
7 MOVEMENT PATTERNS WITHIN AUCKLAND – SELECTED KEY EMPLOYMENT CENTRES …………………….. 63
7.1 INTRODUCTION ……………………………………………………………………………………………………………………….. 63
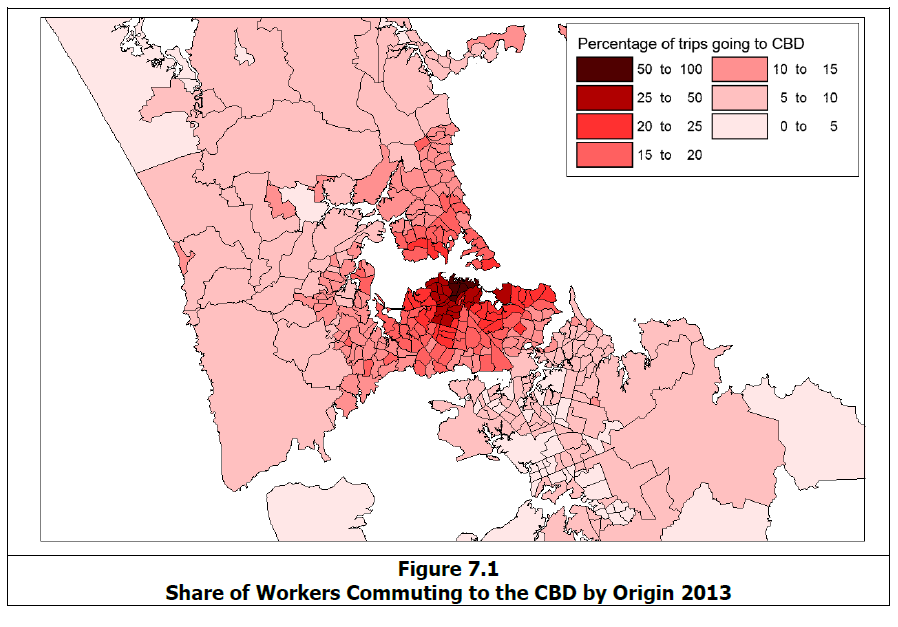
7.2 CBD ……………………………………………………………………………………………………………………………………. 64
7.3 EMPLOYMENT CENTRES AWAY FROM THE CBD ………………………………………………………………………………….. 67
7.3.1 Introduction ……………………………………………………………………………………………………………………. 67
7.3.2 North Harbour…………………………………………………………………………………………………………………. 68
7.3.3 Takapuna/Westlake …………………………………………………………………………………………………………. 69
7.3.4 Henderson ………………………………………………………………………………………………………………………. 70
7.3.5 Newmarket …………………………………………………………………………………………………………………….. 72
7.3.6 Onehunga/Penrose ………………………………………………………………………………………………………….. 73
7.3.7 Ellerslie South ………………………………………………………………………………………………………………….. 74
7.3.8 Highbrook/East Tamaki ……………………………………………………………………………………………………. 76
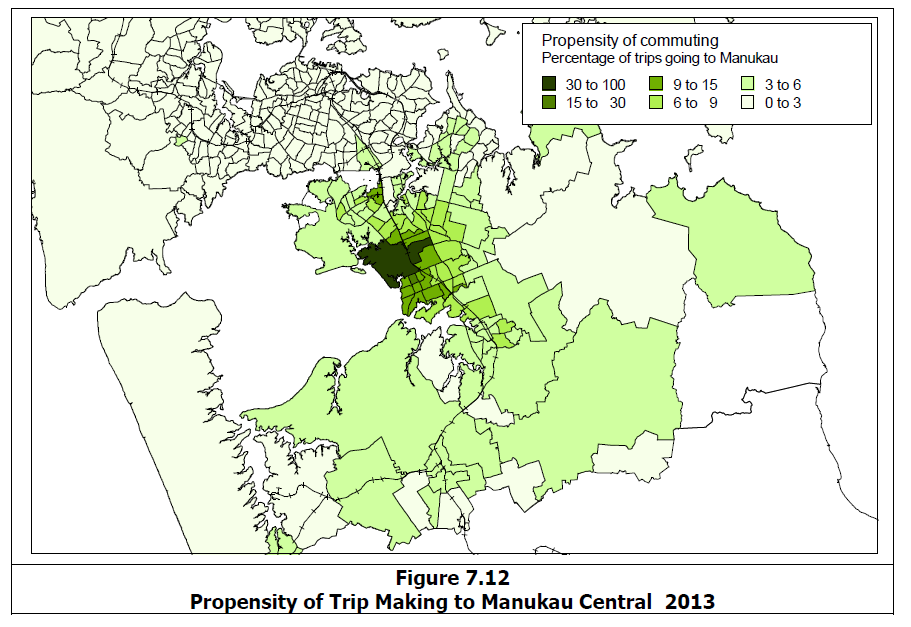
7.3.9 Manukau Central …………………………………………………………………………………………………………….. 78
7.3.10 Airport and Environs …………………………………………………………………………………………………….. 79
7.3.11 Summary of Characteristics of Other Employment centres ………………………………………………… 81
7.3.12 Changes in Modal Splits 2006-2013 ……………………………………………………………………………….. 83
And
APPENDIX B ………………………………………………………………………………………………………………………………. 121
IMPACT OF TRANSPORT INVESTMENT ON LAND USE …………………………………………………………………………. 121
B1. INTRODUCTION ……………………………………………………………………………………………………………………… 122
B2. TOTAL POPULATION GROWTH IN THE AUCKLAND REGION ……………………………………………………………………. 122
B3 POPULATION GROWTH ALONG THE RAIL CORRIDORS …………………………………………………………………………. 123
B3.1 Total Population Growth by Line ……………………………………………………………………………………… 123
B3.2 Population Growth by Line Segment…………………………………………………………………………………. 123
B4 DETAILED POPULATION GROWTH FROM 2006-2013 ………………………………………………………………………… 125
B5 OVERALL ASSESSMENT …………………………………………………………………………………………………………….. 127
However, thus far I have deduced the following from the report:
- Public Transport as mode share is increasing at the expense of private transport mode share for the most (but not all) parts
- The City Centre draws its workers from itself, the Lower North Shore, inner Isthmus and those close to the Western Rail Line
- South Auckland is something of an enigma with the bulk of its commutes within itself or to Penrose-Onehunga. It was noted increased commuting concentrations to the Heavy Industrial complexes in the south, the Airport and Manukau City Centre.
- Manukau City Centre like the main City Centre draws the bulk of its workers from either within itself or within close proximity. However, both Centres have a large catchment with the City Centre attracting workers from the Isthmus, lower North Shore and those near the Western (rail) Line. Manukau City Centre draws widely (and extensively) from all of the Southern Auckland area.
- Note: Students were not measured so we do have skewering
- While the workforce is increasing in the City Centre so is our population. Thus relative to proportions the percentage numbers and where they are coming from in their commute to the CBD does not change highly
- Southern Auckland again does the heavy lifting with it both having the highest population concentration in Auckland as well as population growth (see below).
| Table B.1 Growth in Population of the Auckland Region 2001-2013 | |||||||||
| Area | Total Resident Population | Total Growth | |||||||
| 2001 | 2006 | 2013 | 2001-2006 | 2006-2013 | |||||
| Total Region | |||||||||
| Total Auckland exc CBD | 1,150,101 | 1,283,598 | 1,384,212 | 11.6% | 7.8% | ||||
| Individual Former Cities or Districts Potentially Impacted by Rail | |||||||||
| Waitakere | 169,569 | 187,281 | 200,826 | 10.4% | 7.2% | ||||
| Auckland City exc CBD | 349,275 | 374,631 | 395,772 | 7.3% | 5.6% | ||||
| Manukau, Papakura & Franklin | 362,478 | 418,446 | 453,378 | 15.4% | 8.3% | ||||
| Combined Areas | 881,322 | 980,358 | 1,049,976 | 11.2% | 7.1% | ||||
An extract showing the City Centre and Manukau City Centre journey origins to both those places
City Centre
Manukau City Centre
Needless to say I think the Auckland Plan might need to be reviewed. More on this soon in the series
The Report
Executive Summary

