
The “Auckland’s Commuting Journeys – A Series. #Major non City Centre Employment Centres” is coming. Just a bit of heavier analysis happening
Apologies if you were looking for the next Auckland’s Commuting Journeys post this morning. As the respective upcoming post deals with South Auckland (which is an enigma in the Paper’s analysis) and some more information has come to light yesterday (rates revaluations which showed where the residential growth is happening, as well as a Committee looking at the South Auckland industrial complexes) I am going to split that part of the particular series up.
This will allow me to give deeper Geographic analysis than otherwise possible especially with what the Economic Development sub-Committee is about to discuss in regards to South Auckland’s industrial sites.
Remembering from the initial conclusions I drew in: Auckland’s Commuting Journeys – A Series. #Introduction
- Public Transport as mode share is increasing at the expense of private transport mode share for the most (but not all) parts
- The City Centre draws its workers from itself, the Lower North Shore, inner Isthmus and those close to the Western Rail Line
- South Auckland is something of an enigma with the bulk of its commutes within itself or to Penrose-Onehunga. It was noted increased commuting concentrations to the Heavy Industrial complexes in the south, the Airport and Manukau City Centre.
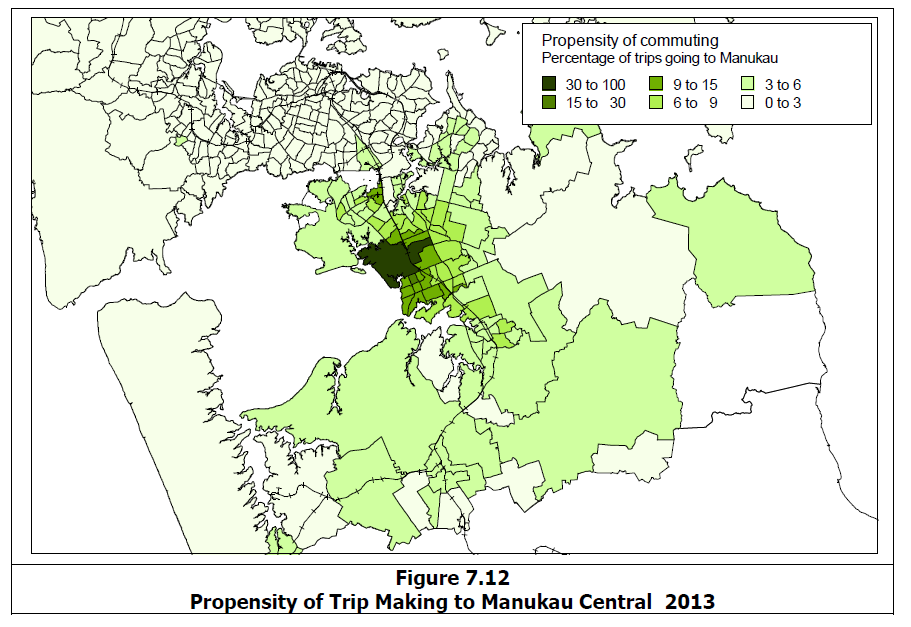
- Manukau City Centre like the main City Centre draws the bulk of its workers from either within itself or within close proximity. However, both Centres have a large catchment with the City Centre attracting workers from the Isthmus, lower North Shore and those near the Western (rail) Line. Manukau City Centre draws widely (and extensively) from all of the Southern Auckland area.
- Note: Students were not measured so we do have skewering
- While the workforce is increasing in the City Centre so is our population. Thus relative to proportions the percentage numbers and where they are coming from in their commute to the CBD does not change highly
- Southern Auckland again does the heavy lifting with it both having the highest population concentration in Auckland as well as population growth (see below).
| Table B.1 Growth in Population of the Auckland Region 2001-2013 | |||||||||
| Area | Total Resident Population | Total Growth | |||||||
| 2001 | 2006 | 2013 | 2001-2006 | 2006-2013 | |||||
| Total Region | |||||||||
| Total Auckland exc CBD | 1,150,101 | 1,283,598 | 1,384,212 | 11.6% | 7.8% | ||||
| Individual Former Cities or Districts Potentially Impacted by Rail | |||||||||
| Waitakere | 169,569 | 187,281 | 200,826 | 10.4% | 7.2% | ||||
| Auckland City exc CBD | 349,275 | 374,631 | 395,772 | 7.3% | 5.6% | ||||
| Manukau, Papakura & Franklin | 362,478 | 418,446 | 453,378 | 15.4% | 8.3% | ||||
| Combined Areas | 881,322 | 980,358 | 1,049,976 | 11.2% | 7.1% | ||||
……………………………………………………………………….
Once the analysis is up I shall let you know.
I do thank you for your patience folks 🙂

