
A look at who commutes to the City Centre and where from

Note: Simulation Only. Not depicting Auckland
I will be running a series of posts on Auckland’s commuting journeys from home to the work place and back again. The information on Auckland’s commuting journeys is based on the Ministry of Transport commissioned paper done by Richard Paling. You can see the full paper here which based its statistical analysis on the 2001, 2006 and 2013 Censuses: http://www.scribd.com/doc/236566739/Richard-Paling-Report-Transport-Patterns-in-the-Auckland-Region . I do point out those as the material is bases on the Censuses we have limitations insofar as students commuting to and from tertiary institutions were not counted (so some 125,000 students across the institutions at the minimum). So we must bear this in mind when doing out analysis interpretations. An example of this is the Eastern and Southern Rail Lines and who takes them. More on this when I get to the City Centre part of the series.+
| Table B.1 Growth in Population of the Auckland Region 2001-2013 | |||||||||
| Area | Total Resident Population | Total Growth | |||||||
| 2001 | 2006 | 2013 | 2001-2006 | 2006-2013 | |||||
| Total Region | |||||||||
| Total Auckland exc CBD | 1,150,101 | 1,283,598 | 1,384,212 | 11.6% | 7.8% | ||||
| Individual Former Cities or Districts Potentially Impacted by Rail | |||||||||
| Waitakere | 169,569 | 187,281 | 200,826 | 10.4% | 7.2% | ||||
| Auckland City exc CBD | 349,275 | 374,631 | 395,772 | 7.3% | 5.6% | ||||
| Manukau, Papakura & Franklin | 362,478 | 418,446 | 453,378 | 15.4% | 8.3% | ||||
| Combined Areas | 881,322 | 980,358 | 1,049,976 | 11.2% | 7.1% | ||||
A quick recap can be seen at “A First Look at “Journey to Work Patterns in the Auckland Region”” in regard to the transport paper.
—————————————————————————————————
Source: pic.twitter.com/vjQZfMUeex
Commuting to the City Centre
In this post I will look at the “MOVEMENT PATTERNS WITHIN AUCKLAND – SELECTED KEY EMPLOYMENT CENTRES” chapter with specific focus on the City Centre (or Central Business District (the CBD)). In subsequent posts I will look at travel patterns for the at the other major employment centres the paper noted. Towards the end of the series I will make an evaluation on the Auckland Plan based on my interpretations from the paper. In short though I can say from reading the paper front to back already the Auckland Plan does need a review at the minimum.
Some Key Facts from the research paper
[Note: it does cover the other employment centres. However, they will be covered in subsequent posts]
Key Findings
Commuting journeys to the CBD are mainly from the Isthmus and to smaller extent from the southern part of the North Shore.
Increases in trip making to the CBD between 2006 and 2013 have come from within the CBD itself and a number of locations distributed across the Region but without any clear patterns. There have, however, been decreases in trips from a number of areas, including those immediately to the west of the CBD and also to the south of the rail corridor west of Newmarket.
The patterns of commuter trip making to a selection of other major employment centres across the Region have been examined.
For most of these centres commuter trips are drawn from areas further away from the centre of the city and the degree of outbound commuting is limited.
For these smaller centres there is only very limited commuting across the Waitemata Harbour – even for Takapuna which is reasonably accessible to the Harbour Bridge and the Devonport ferry.
For these employment centres the share of private vehicle trips is typically higher than the regional average. To some extent this reflects the nature of employment in these areas and in many cases the lack of public transport services which are attractive to many workers.
Bus use is high in Newmarket and Takapuna/Westlake which are served by major bus corridors.
Rail use is higher than the regional average in Newmarket, Henderson and Ellerslie South which lie along the rail corridors, but is low in Onehunga/Penrose which also has a rail connection.
Travel distances are also higher than the regional average for all areas but the difference is small for Newmarket.
Between 2006 and 2013, the public transport share has increased at all the centres except Highbrook/East Tamaki, although in some instances the increase is very small.
The private vehicle share has fallen at all centres except Highbrook/East Tamaki and the Airport. For these it has increased slightly to 94 per cent
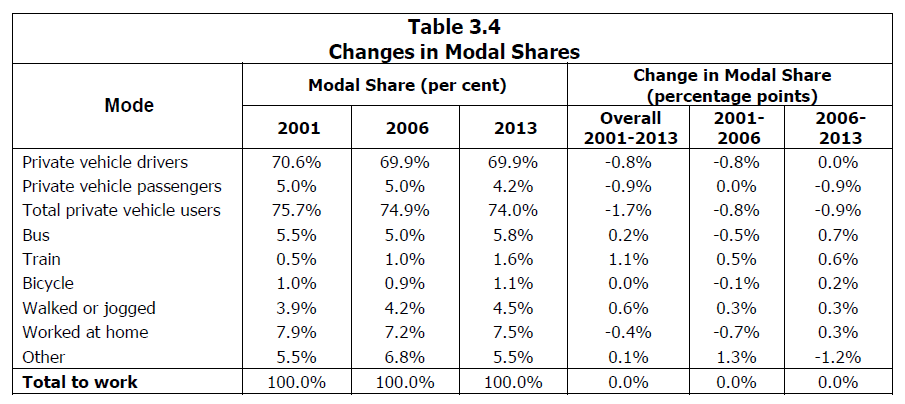
Those mode share changes
So those Key City Centre points
- Commuting journeys to the CBD are mainly from the Isthmus and to smaller extent from the southern part of the North Shore.
- Increases in trip making to the CBD between 2006 and 2013 have come from within the CBD itself and a number of locations distributed across the Region but without any clear patterns. There have, however, been decreases in trips from a number of areas, including those immediately to the west of the CBD and also to the south of the rail corridor west of Newmarket.
- Between 2006 and 2013, the public transport share has increased at all the centres except Highbrook/East Tamaki, although in some instances the increase is very small.
Now these are commuting trips and miss out on tertiary students that can get as high as 125,000 across the Universities, techs, and Private Institutions. For example while the Eastern Line trains are chocker into Britomart, the Southern Line trains are not so chocker at Britomart normally. This is because the Southern Line trains lose most of their commuters at: Penrose, Ellersile and Newmarket before finally getting to Newmarket. So we need to bear this in mind with our transport planning, something AT-HOP should assist with.
The City Centre and where the commuting journeys come from
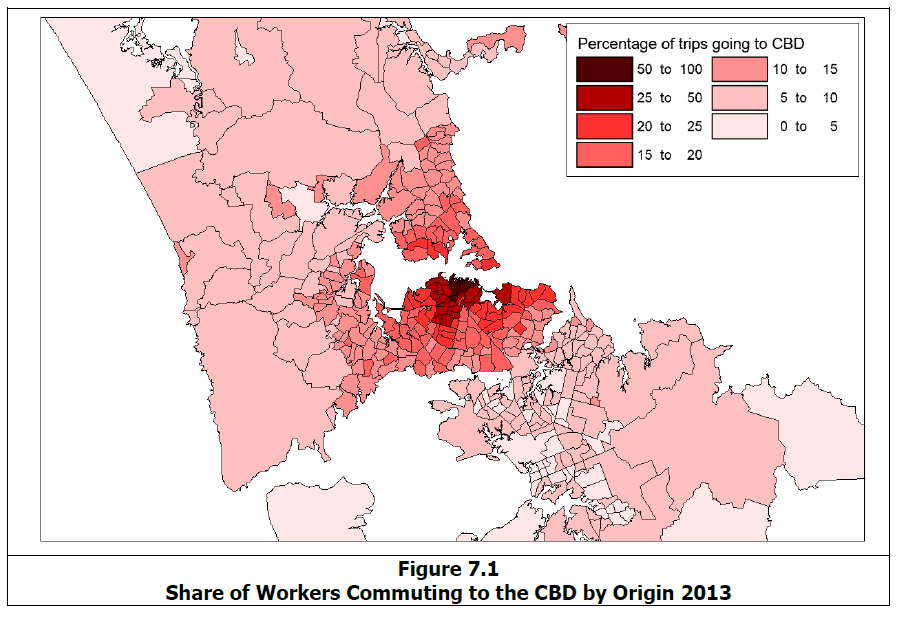
The paper theorises:
The share of workers commuting to the CBD as a proportion of the total commuting trips from the area is highest within the CBD itself with a share of 45 per cent or more, and then declines in broadly concentric bands with a proportion of 25 per cent or more from a ring including the CBD fringe. It is noticeable that this ring excludes the North Shore possibly suggesting that the harbour acts as a perceived barrier to travel. Further afield there is an area which has a relatively high propensity to travel to the CBD which lies along the route of the Northern Busway and the Northern Motorway. Interestingly there appear to be no similar impacts along the lines of the Rapid Transit Network (RTN) or motorway south of the Manukau Harbour, although this may reflect the socio-economic characteristics of workers living to the south with lower proportions attracted to the types of jobs in the CBD.
Yes and no with Southern Auckland commuting north in lesser numbers owing to socio-economics. I would be more inclined to say Southern Auckland is more drawn to Manukau City Centre and the industrial complexes in the South. This aspect will be looked at when I analyse Southern Auckland’s employment centres.
Modal Share Commuting to the City Centre
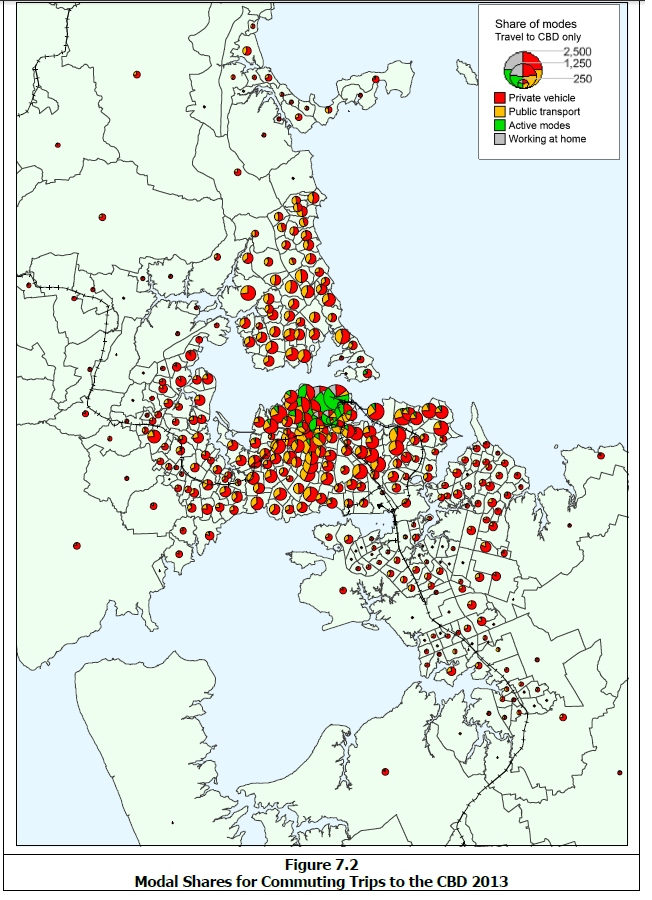
As you can see the bulk the commuting trips to the City Centre stem from the Isthmus (including the City Centre itself) and the lower North Shore. However, you can see other concentrations along the Western Rail Line as far as Henderson and along the North Western Motorway as far the Westgate area. Another concentrations also include the Howick/Botany area (so that plays into socio-economics as mentioned for Southern Auckland) and the areas close to the Southern Line as far south as Papatoetoe.
Looking at changes we have the following

The paper theorising:
The position displayed in Figure 7.4 presents no clear patterns of change to the CBD with, in general, areas of increases in the shares of workers adjacent to areas of decrease. The only areas where increases coincide with infrastructure improvements is in the corridor between Mt Wellington and Manurewa, which is served by an improved rail service, but in other areas these improvements appear to have little systematic impact on the shares of workers to the CBD.
Infrastructure Improvements such as:
- Double Tracking of the Western Line and subsequent increases in frequencies
- Increases in frequencies on the Southern and Eastern Lines. Station upgrades also done at most stations
- The Northern Bus Way
- Continued improvements along the Southern Motorway
However, as the paper noted “improvements appear to have little systematic impact on the shares of workers to the CBD” – apart from between Mt Wellington and Manurewa (which is served by the Southern Motorway and the Southern and Eastern Lines (which has seen station upgrades and increases in train frequencies).
Concluding remarks?
That infrastructure improvements do not necessarily mean more people commuting to the City Centre for work. BUT as I have said the Census does not catch students, off-peak “recreational” travellers, or senior citizens who are not working if the Eastern Line is anything to go by most days of the week (including weekends). That said it does serve as a warning though when committing to infrastructure investment. If we invest say more heavily in rail and buses will the mode share change from private to public transport. My previous post suggests not. The other thing is where are people going? Sure we can invest all this infrastructure to get people to the City Centre but are people going to the City Centre?
The Isthmus, lower North Shore and those close to the Western Rail Line or North Western Motorway are but South Auckland for the most part is not.
Again our land/transport planning via the Auckland Plan needs to be reviewed. Something that will be emphasised when I cover these employment centres next:
- Ellerslie South
- Highbrook/East Tamaki
- Manukau Central
- The Airport
Richard Paling Report Transport Patterns in the Auckland Region

