
A look at who commutes to the Major non City Centre Employment Centres and where from
Note: In this post will look as an overview to the commuting trends to and from the non City Centre employment centres. I will later on in the series tie up commuting patterns to trends in residential property values (in light of the revaluations) and the big planning pushes with the South Auckland Industrial complexes, and the 10 Spatial Priorities set out by Council.
I am running a series of posts on Auckland’s commuting journeys from home to the work place and back again. The information on Auckland’s commuting journeys is based on the Ministry of Transport commissioned paper done by Richard Paling. You can see the full paper here which based its statistical analysis on the 2001, 2006 and 2013 Censuses: http://www.scribd.com/doc/236566739/Richard-Paling-Report-Transport-Patterns-in-the-Auckland-Region . I do point out those as the material is bases on the Censuses we have limitations insofar as students commuting to and from tertiary institutions were not counted (so some 125,000 students across the institutions at the minimum). So we must bear this in mind when doing out analysis interpretations. An example of this is the Eastern and Southern Rail Lines and who takes them. More on this when I get to the City Centre part of the series.+
| Table B.1 Growth in Population of the Auckland Region 2001-2013 | |||||||||
| Area | Total Resident Population | Total Growth | |||||||
| 2001 | 2006 | 2013 | 2001-2006 | 2006-2013 | |||||
| Total Region | |||||||||
| Total Auckland exc CBD | 1,150,101 | 1,283,598 | 1,384,212 | 11.6% | 7.8% | ||||
| Individual Former Cities or Districts Potentially Impacted by Rail | |||||||||
| Waitakere | 169,569 | 187,281 | 200,826 | 10.4% | 7.2% | ||||
| Auckland City exc CBD | 349,275 | 374,631 | 395,772 | 7.3% | 5.6% | ||||
| Manukau, Papakura & Franklin | 362,478 | 418,446 | 453,378 | 15.4% | 8.3% | ||||
| Combined Areas | 881,322 | 980,358 | 1,049,976 | 11.2% | 7.1% | ||||
A quick recap can be seen at “A First Look at “Journey to Work Patterns in the Auckland Region”” in regard to the transport paper.
—————————————————————————————————
Commuting To and From Major Employment Centres outside of the City Centre
In the last series post I looked at commuting patterns to and from the City Centre. In this series post I take a look at our big employment centres to the south of the City Centre. Notably these are large heavy industry complexes with the exception of Manukau Central that has the Manukau City Centre included within it. If you are looking for other commuting trends outside of the below listed Centres I recommend reading the Paper from page 63 (I cover the other centres later on). The Centres I am looking at in this post:
- Onehunga/Penrose
- Ellerslie South
- Highbrook/East Tamaki
- Manukau Central
Again I am doing an overview of the commuting trends from the above mentioned centres. I am aware Council has been discussing and endorsing the “Integrated business precinct plan: industrial south Auckland” at the Economic Development Committee yesterday. I will come to that particular agenda item once I have covered the other Centres from the research paper.
The Richard Paling Report Transport Patterns in the Auckland Region took a look at the major employment centres outside of the main City Centre. Depending on where the Centre was located and its proximity to transport infrastructure was how far of a catchment that particular Centre drew its workers from.
I start with Onehunga/Penrose which forms part of the Isthmus’s heavy industry complex, arguably the oldest and largest of the industrial complexes in Auckland
The Catchment for the Onehunga/Penrose area for which is draws in nearly 20,000 commuters
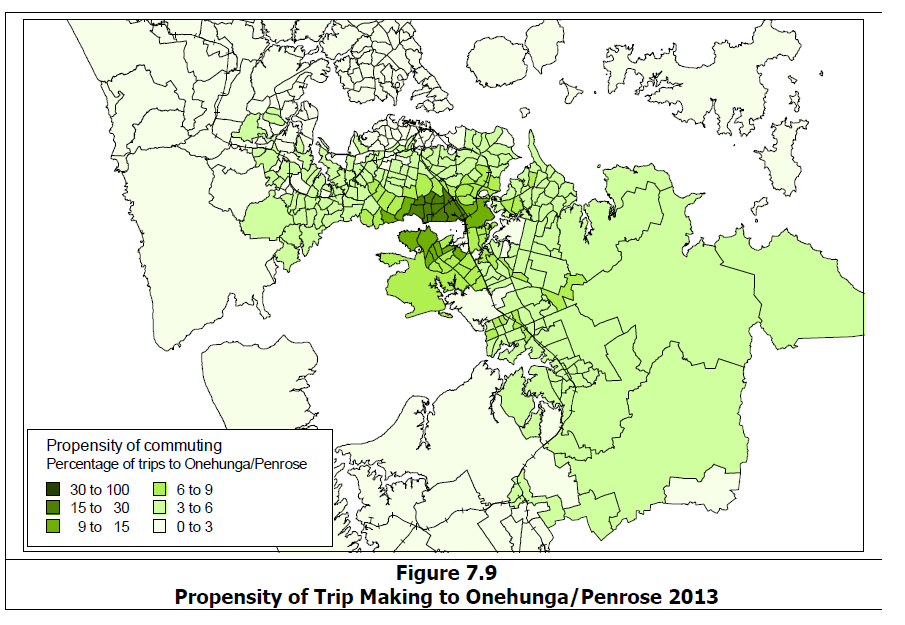
The Paper comments:
Because of the high level of employment in the area, workers are drawn from wide areas of the Region. There is a particular concentration from workers living either just to the north of the Mangere Inlet in a band stretching from Hillsborough to Mt Wellington or to the south of the Inlet, and more generally to the south and east including Otahuhu and Manurewa. There is relatively little commuting from the northern parts of the Isthmus, and the North Shore.
I would also add further comment that with Onehunga and Penrose being predominately a heavy industrial complex it will be a magnet for blue-collar workers that currently reside primarily in Southern Auckland and the southern Isthmus area while drawing a more limited amount further out. Socio-economics would also come into play here with the North Shore and areas being near the City Centre more affluent and not as drawn to the industrial complex in Penrose/Onehunga.
Modal Share for Penrose/Onehunga
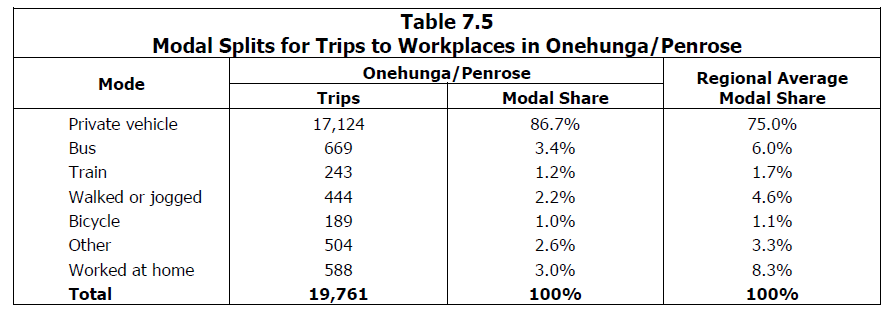
The paper commenting:
Compared to the position for the Region as a whole, Onehunga/Penrose as an employment area has a high share of private transport movements and low shares of both bus and train users, despite the reinstatement of rail services to Onehunga. There are also low shares of active mode trips although the share for bicycle is only just below the regional average.
The high share of private transport trips reflects the nature of the employment in the area with frequent shift working at times when public transport services are not available or, at best, limited. Much of the employment is also remote from public transport routes and there is also substantial car parking available in the area.
The average trip length for commuting journeys to the area is 13.9 kms about 15 to 20 per cent longer than the regional average. This in part reflects its location bounded by the Inlet which increases the journey distances of those travelling from the south and the high share of private vehicle trips which typically have longer trip lengths.
So we have a two prong situation where the geography means people have to commute around the Mangere Inlet, and despite the Onehunga Line we have a high amount of private trips to the industrial complex. This tells me that we really need the frequencies of the Onehunga Line to step up while bus routes need improving in feeding the Onehunga/Penrose industrial complex. As industry runs more in shift patterns than a commercial centre your public transport system needs to be at high frequency all day, not just the traditional peaks. The All Day Network is something Auckland Transport is establishing starting in South Auckland mid 2015.
I do point out with our long-term planning that there is a chance this industrial complex could disband over the next 50 years and become new residential and commercial sites – despite the new Integrated Business Precinct Plan set up by Council to protect industrial land.
Ellersile South
While smaller at 7,300 commuting to the Ellersile South business park area , the area has grown quite rapidly as the paper points out:
Although relatively small with about 7,300 commuting trip destinations in 2013, a similar size to Henderson, Ellerslie South is a rapidly growing centre in the southern Auckland Isthmus. According to BDD7 figures, employment here has increased by almost a quarter between 2006 and 2013, compared to regional growth of about 5 per cent over the same period. The propensity for commuting into Ellerslie South in 2013 is set out in Figure 7.10.
What got me surprised was Ellersile South’s catchment as seen below

That is quite a narrow catchment despite Ellersile being close to the Southern Motorway and the Southern Rail Line. I found that odd as my commuting trips on the Southern Line in the peak morning trips were usually packed until Ellersile and then about 15% getting off. Then again most of the Southern Line passengers get off at Newmarket anyhow.
The paper commented:
Ellerslie South as a relatively small employment zone has a limited focussed catchment area where it attracts high proportions of the total workers in a CAU. This catchment area mainly covers the immediately surrounding areas and also areas slightly further to the north-east. Despite its position next to the rail and motorway corridors, there is little evidence of significant volumes of the longer distance commuting that would be facilitated by these.
Ellersile South’s Mode Share
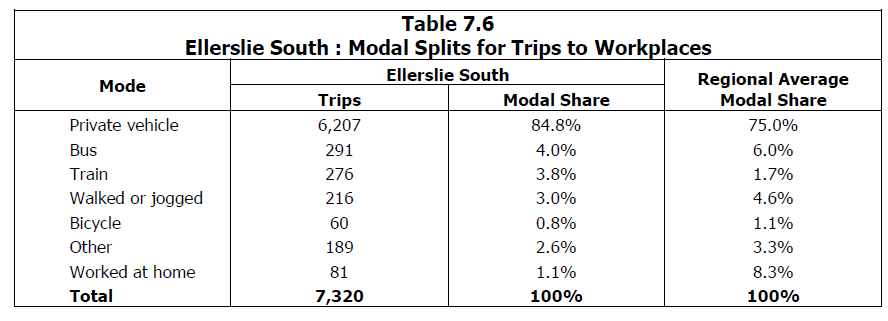
The paper mentioned:
Compared to the regional position, Ellerslie South has a high proportion of private vehicle trips and also a high proportion of commuting by train, reflecting its position on the Southern Line and on the junction with the Onehunga Branch Line. In part this is balanced by a relatively low share of bus trips with a total public transport share that is in line with the regional average. The share of work at home trips is very low. The average trip length for commuting journeys to the area is 13.5 kms about 15 per cent longer than the regional average of 11.8 kms.
While train commutes are relatively high Auckland Transport will need to work on the buses in the area to get that mode share up.
East Tamaki and Highbrook
I believe the East Tamaki/Highbrook Industrial Complex is the second biggest behind Penrose/Onehunga with some 17,000 commute trips to this complex. While parts of East Tamaki is as old as the Wiri industrial complex (so from about the 1960’s) Highbrook and along Te Irirangi Drive area are pretty new (since the 1990’s). That said the transport system in the area really stinks and shows the lack of foresight from the Manukau City Council (prior to the Auckland Council’s inception in 2010).
Lets take a look at the catchment first
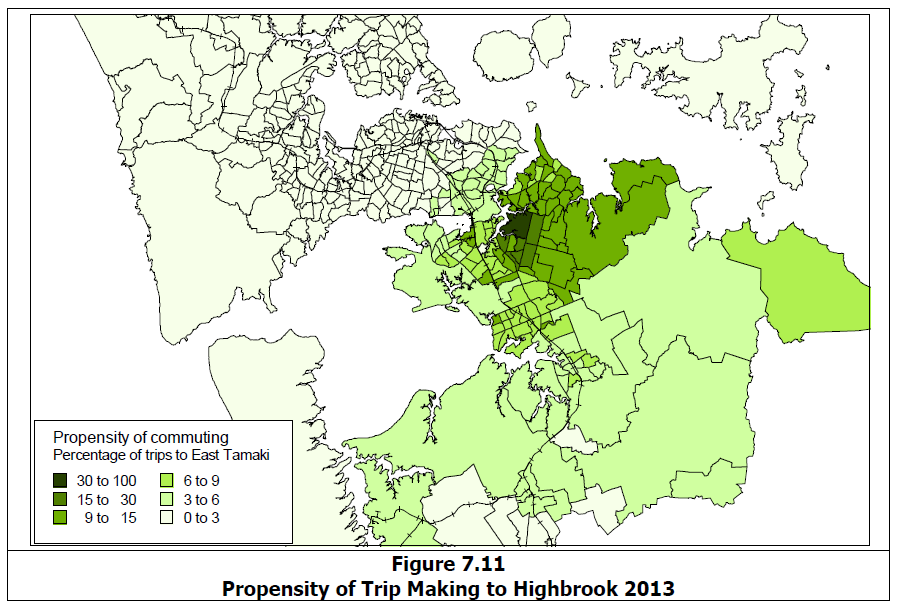
The paper comments:
Highbrook/East Tamaki draws workers from a wide area particularly from the north and east although with relatively few trips from the Isthmus and only limited trips from the areas immediately to the west.
I would also add Highbrook draws in a limited amount from the Manurewa and Papakura areas as well. Otherwise its primary workforce base is drawn from the Southern Auckland eastern suburbs.
Mode Share
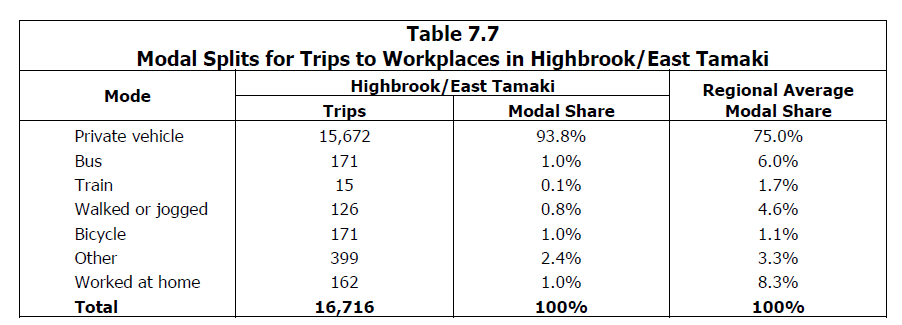
The paper comments:
Commuters into the area have a particularly high private vehicle share of about 94 per cent substantially above the regional average of 75 per cent. The public transport share is very small at just over 1 per cent compared to the regional average of 7.7 per cent. In part this reflects the dispersed nature of the employment in the area with many workplaces being at a substantial distance from the main roads in the area, in part the nature of employment with substantial numbers working shifts requiring travel when public transport services are limited or non-existent, and in part the ready availability of car parking.
The average distance for journeys to the area is 14.1 kms, about 20 per cent higher than the regional average. This reflects the wide catchment area from which commuting to the area is drawn, the high proportion of private vehicle trips for which trip lengths tend to be relatively long, and the low share of active mode journeys.
Look the planning for that area is absolutely appalling and will take some serious fixing up if we are to get public transport services into that area up to scratch and of decent meaning. The Highbrook Interchange is a total dog in the peak periods and is dangerous as well for the traffic it handles. Highbrook should be a lesson on how auto-centric sprawl works for an employment centre. That is: IT DOES NOT WORK. Highbrook should have never been an industrial centre but rather a residential centre. Wiri and what is Botany now (so between Botany Metropolitan Centre, Otara and part of modern-day Flatbush) should have been the industrial site as the road, bus (and future rail if the Botany Line is built) access to such an industrial site would have been easier there than what Highbrook is now. Also having industry flank the beautiful Tamaki Estuary seems to be a waste…
Manukau Central
This area covers what is known as Manukau City Centre. It does not cover the Wiri industrial complex which has numerous commuting trips drawn to it. I will be covering Manukau City Centre, and the Wiri complex further on in this series when I look at the Council’s business precinct plan more in-depth.
Manukau’s Catchment

The paper notes:
The area attracts a high proportion of trips from itself and from the areas immediately to the east and south. There is little trip making from areas to the north of the Mangere Inlet and from the Isthmus in general but more substantial trip making from the south along the north-south transport corridor.
Effectively Manukau City Centre (Manukau Central) like the City Centre draws mainly from its immediate surrounds with more limited catching further out. However, again like the City Centre and unlike most of the other Centres (apart from North Harbour (Albany) and Takapuna which I will cover later) Manukau’s catchment is quite wide insofar as the catchment being Southern Auckland in its entirety. As a comparison, Manukau I have deemed a Super Metropolitan Centre while Albany or Takapuna would also be one. More on this in relation to commuting patters later on in the series.
Like the City Centre, Manukau City Centre’s catchment is amplified by the main transport corridors that serve it. The City Centre has the motorways, buses and Britomart Station serving buses and trains. Manukau has motorways, the rail line (although only just recent) and the buses with Manukau having its own existing (and soon to be rebuilt further west) bus interchange. So we do see similar (although there are size differences) comparisons to the two City Centres with their catchments.
Manukau’s Mode Share

The paper notes:
The area has a particularly high share of private vehicle trips at over 90 per cent compared with a regional average of 75 per cent. The rail share is low despite the opening of the Manukau Rail Link which provides access to the area, and there are also low shares for bus, active modes and working at home. The high private vehicle share probably reflects the socio-economic characteristics of the area and the types of jobs available, which in many cases are not conveniently served by public transport.
The average trip distance for those with jobs in Manukau Central is 15.4 kms. This is relatively high in relation to the regional average of 11.8 kms. This reflects the relatively high share of trips travelling some distance from the east and south which is probably in turn reflected in the high share of private vehicle trips.
Despite being served by buses and the Manukau Rail Station, Manukau City Centre was designed as a auto-centric sprawl centre rather than a more urbanised pro-people place it is aspiring to be. Manukau was founded in the 1960’s at the height of New Zealand’s drive to sprawl out and decentralised away from main city centres. So following the American example. This has hurt Manukau with most of the current land taken up by surface parking as you can see below:
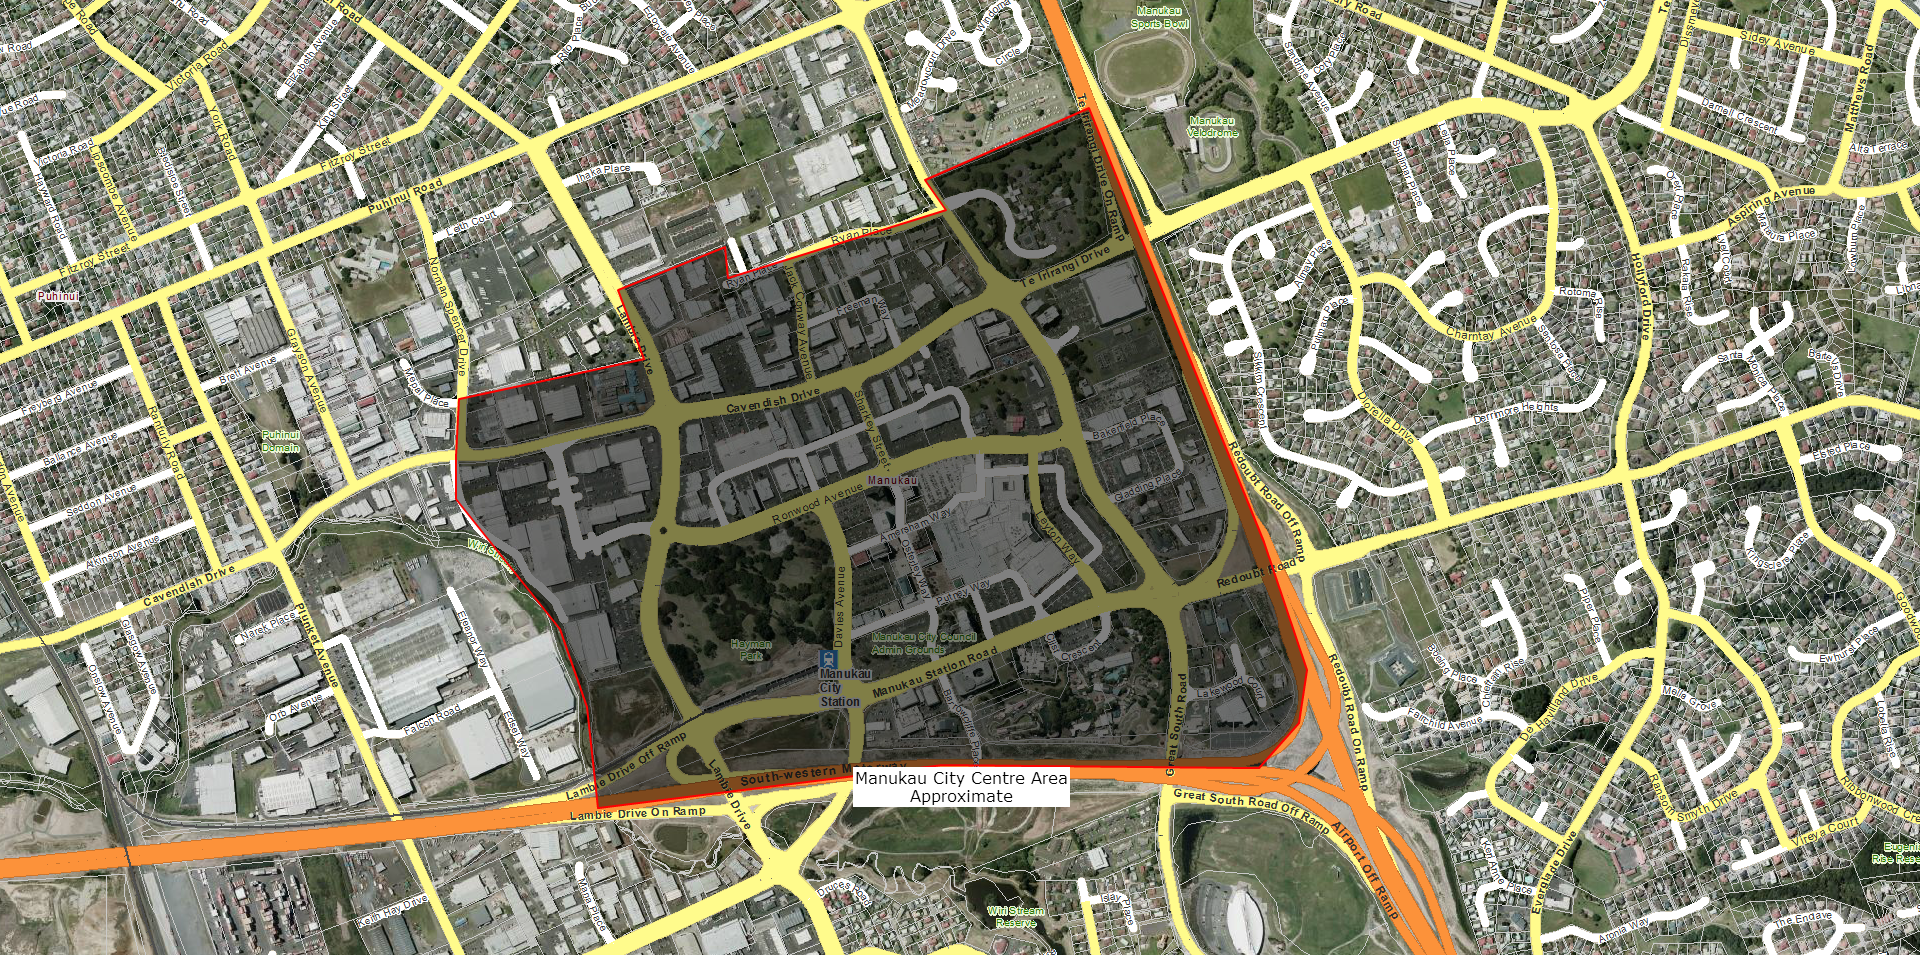
Even if you come in by train or bus, the sprawled and car dominate nature of Manukau does not make it easy to walk or cycle around in (nor pleasant either).
Manukau City Centre serves as warning on not how to do a City Centre (it is a City Centre for South Auckland as its name – Manukau City Centre implies) based on the car. However, Manukau is having increased attention focused on it to make the place more people friendly. The Manukau Station (with the Manukau Rail South Link pending (it would allow direct Pukekohe/Papakura to Manukau services every 15 minutes without transferring as current at Puhinui Station)) and upcoming Manukau Bus Interchange will give the infrastructure to allow better public transport services in and out of Manukau City Centre. Auckland Transport’s New South Auckland Bus Network overhauls the bus network in South Auckland with new routes and better frequencies. Manukau City Centre via its upcoming new bus interchange will be one of the two central bus/rail hubs (the other being the upcoming Otahuhu Interchange) will be serviced by the new network. The Otara-Papatoetoe Area Plan had a dedicated section on “humanising” Manukau over the next thirty years. It is the aim of the Area Plan to turn Manukau from a low density, auto centric sprawling centre to a higher density people friend centre.
Thus Manukau City Centre with its wide catchment that rivals the City Centre should become a grand example of how to undertake a large urban renewal program turning a pro car place into a pro people place!
Concluding Remarks
Our other major employment centres have a varying degree of impact on commuting patterns in Auckland. Apart from Ellersile with its higher than regional average train mode share, most of these other centres were reliant on the car for commuting. This shows our planning not only needs to focus on the providing quality transport links to the City Centre but to our other major centres as well (so what is known as cross city commuting). This post did show the amount and catchment of workers to both of the two large industrial complexes covered in this post as well as Manukau City Centre (Manukau Central). This gives further emphasis on making sure our cross city commuting infrastructure is up to par.
Meanwhile the Highbrook/East Tamaki employment centre showed us case of planning failure with a higher than average amount of car trips to the centre than the regional average. While Manukau City Centre shows us how we can turn an auto-centric sprawling centre into a more people-centric centre as the ambitious urban renewal program gets under way per Auckland Council’s ten spatial priorities program.
Next up: The Airport, Takapuna and Albany/North Harbour in my Auckland commuting series
Richard Paling Report Transport Patterns in the Auckland Region

