
A look at commute patterns from selected residential centres in Auckland
I am running a series of posts on Auckland’s commuting journeys from home to the work place and back again. The information on Auckland’s commuting journeys is based on the Ministry of Transport commissioned paper done by Richard Paling. You can see the full paper here which based its statistical analysis on the 2001, 2006 and 2013 Censuses: http://www.scribd.com/doc/236566739/Richard-Paling-Report-Transport-Patterns-in-the-Auckland-Region . I do point out those as the material is bases on the Censuses we have limitations insofar as students commuting to and from tertiary institutions were not counted (so some 125,000 students across the institutions at the minimum). So we must bear this in mind when doing out analysis interpretations. An example of this is the Eastern and Southern Rail Lines and who takes them. More on this when I get to the City Centre part of the series.+
| Table B.1 Growth in Population of the Auckland Region 2001-2013 | |||||||||
| Area | Total Resident Population | Total Growth | |||||||
| 2001 | 2006 | 2013 | 2001-2006 | 2006-2013 | |||||
| Total Region | |||||||||
| Total Auckland exc CBD | 1,150,101 | 1,283,598 | 1,384,212 | 11.6% | 7.8% | ||||
| Individual Former Cities or Districts Potentially Impacted by Rail | |||||||||
| Waitakere | 169,569 | 187,281 | 200,826 | 10.4% | 7.2% | ||||
| Auckland City exc CBD | 349,275 | 374,631 | 395,772 | 7.3% | 5.6% | ||||
| Manukau, Papakura & Franklin | 362,478 | 418,446 | 453,378 | 15.4% | 8.3% | ||||
| Combined Areas | 881,322 | 980,358 | 1,049,976 | 11.2% | 7.1% | ||||
A quick recap can be seen at “A First Look at “Journey to Work Patterns in the Auckland Region”” in regard to the transport paper.
—————————————————————————————————
Looking at Commute Patterns From Select Residential Centres
Previously when looking at the “Journey to Work Patterns in the Auckland Region” I looked people commuting TO work destinations. In this post I am looking at commute patterns FROM residential centres. Note: some of these residential centres like Westgate and Newmarket (both Metropolitan Centres) were also deemed major employment centres (outside of the City Centre) with people commuting towards them.
Looking at the Paling research paper on commuting patterns from residential centres:
Trip Patterns for Selected Residential Locations
8.1 Introduction
As well as considering the patterns of commuting trips to workplaces, an analysis has also been undertaken of the position for a range of residential areas within the Region. These comprise:-
Orewa
Westlake/Takapuna
Albany (including the CAUs of Fairview and Northcross)
Henderson
New Lynn, including Lynnmall and Fruitvale
Westgate
Stonefields
Newmarket
Dannemora (including Kilkenny, Point View and Baverstock Oaks)In total these accounted for about 26,000 commuting trips, around 5 per cent of the total. Because of the ways in which CAUs are defined they typically have a similar resident population (and workforce) and do not individually capture large resident populations.
Key Findings
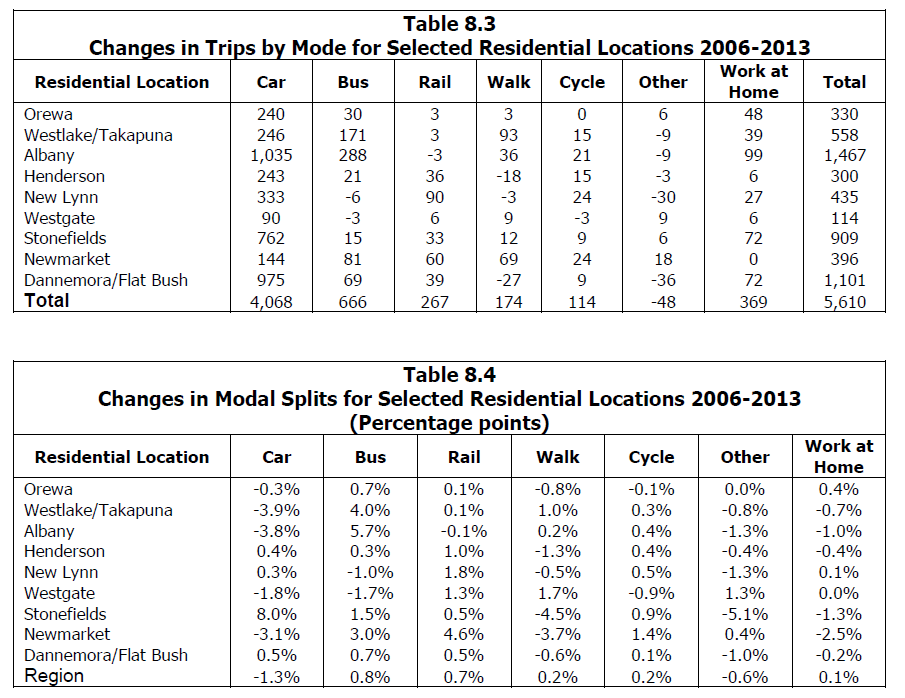
For the newer residential areas of Westgate, Stonefields and Dannemora/Flatbush, the private car share for trips by residents of the area is relatively high at between 83 and 86 per cent, compared to the regional average of 75 per cent. Despite having an inner urban location, Stonefields has a private transport share that is higher than surrounding areas and is characteristic of development areas on the periphery of the urban area.
The bus share is higher than the regional average at Westlake/Takapuna, Albany and Newmarket.
The rail share is relatively high at Newmarket, New Lynn and Stonefields although for the last the overall public transport share is low.
In general between 2006 and 2013, the private vehicle mode share has declined in most areas, although there were increases for Henderson, New Lynn, Stonefields and Dannemora/Flat Bush.
Bus shares have generally increased except for Westgate and New Lynn where these have probably been reduced because of a switch to rail.
Changes in the numbers of active trips have varied with no clear pattern.
………
To be honest this is somewhat expected: the newer subdivisions from the 1990’s up until around now (and still continuing in Legacy areas such as Westgate and Flatbush/Dannemora) are auto-centric and designed around the car while older subdivisions were built close to major transport nodes/lines like Takapuna, New Lynn and Newmarket. I am weary with Albany as while it does have the Albany Busway Station it also has a very large Park and Ride which encourages people to drive to the station (rather than using feeder buses (if they existed)) thus causing localised congestion in the area. That said Albany is a good example on when Park and Rides don’t work while feeder buses would.
Stonefields proves what happens when both a Legacy Council (Auckland City Council) and the current Council (Auckland Council) can’t get their act together around transportation in a new subdivision. Stonefields when planned and built was designed to be served with a bus route and easy access to either Glen Innes Station or the reopened Tamaki Station. However, our Council’s (past and present) seem to be muddling around in providing the promised link from Stonefield to the Eastern Line and as a result we get a high private mode share when people were looking forward to actually taking the train.
As for private mode share increases in Henderson and New Lynn despite both sitting on major bus/train interchanges, I am wondering what is going on there. New Lynn though has copped flak recently for having 21 sets of traffic lights and the Metropolitan Centre itself not particularly easy to get round by any mode of transport. I am wondering if New Lynn despite being hailed a planning success is heading down the route Manukau City Centre went down early in its life and is actually reinforcing auto-centric behaviour rather than people-centric behaviour. Maybe once the Western Ring Route is complete as well as some more work to New Lynn as it becomes a Spatial Priority under the 2015-2025 Long Term Plan. For New Lynn’s sake I hope so as it does not want to exactly share the dubious honour of Legacy Planning Failures like Westgate and Flatbush.
Modal Splits

The paper noted
There are considerable differences between the modal splits for the different areas. In particular:-
Newmarket has a relatively low share of private vehicle use at just 43 per cent with relatively high shares of public transport, both bus and rail, and also a very high active mode share of 28 per cent.
Westlake/Takapuna also has a relatively low private vehicle modal share of 63 per cent (compared to the regional average of 75 per cent), again with relatively high shares of public transport (12 per cent), active modes (13 per cent) and also work at home trips.
New Lynn has a high public transport share, with high flows by both bus and rail, reflecting in part the availability of good rail services and in part the focussing of bus routes at the interchange in the area. However despite this high public transport share, the private vehicle share is also broadly in line with the regional average, but with the area having a low proportion of residents working at home.
Despite similar advantages to New Lynn, commuting from Henderson has a much lower public transport share and a private transport share of 77 per cent that is slightly higher than the regional average.
The new development areas of Westgate, Stonefields and Dannemora/Flatbush all have high private vehicle modal shares and low public transport ones. Although Stonefields is a development area within the Inner Urban sector, it has a high private transport modal share which contrasts with the shares of about 70 to 75 per cent in the neighbouring area but which is more characteristic of the Westgate and Flat Bush areas being developed on the urban periphery.
The sites by the sea, Orewa and Takapuna, have relatively high shares of work at home.
….
The Modal Changes
The paper noted:
The comparison set out in Table 8.4 reveals a rather mixed picture across the Region with modal shares typically changing in different directions for different areas.
For Westlake/Takapuna and Albany, there has been a shift in the share of private vehicle use towards bus. It should be noted however that despite the change in the modal split, the number of car trips increased in both these locations, as well as in all the other areas examined. The share working at home also dropped in these areas.
For Orewa, the effect has been more muted with a smaller decline in the private transport mode share and a smaller increase in bus use.
For Henderson and New Lynn there were small increases in the private transport modal share and also in the public transport share, although in the case of New Lynn there was a small shift from bus to rail.
For Newmarket there was a fall in the private vehicle modal share and a large increase in the public transport share. There was also a decline in the share of active mode trips, which although growing had a lower rate of increase than the total for the area.
For the selected centres although the private vehicle mode share declined between 2006 and 2013, the numbers of private vehicle trips increased for each of the areas examined and in all cases was the largest contributor to the growth in commuting trips.In general the position for areas is of a relative decline in the mode share for private trips (although with an increase in the numbers of these), balanced by increases in the public transport share. The share of active modes has varied by area, especially for walking trips.
……
Concluding remarks
As expected those residential centres built close to a major transport node will usually have higher mode share for public transport (Henderson excluded) while those like Dannemora and Stonefields which are newer residential centres have higher private mode shares.
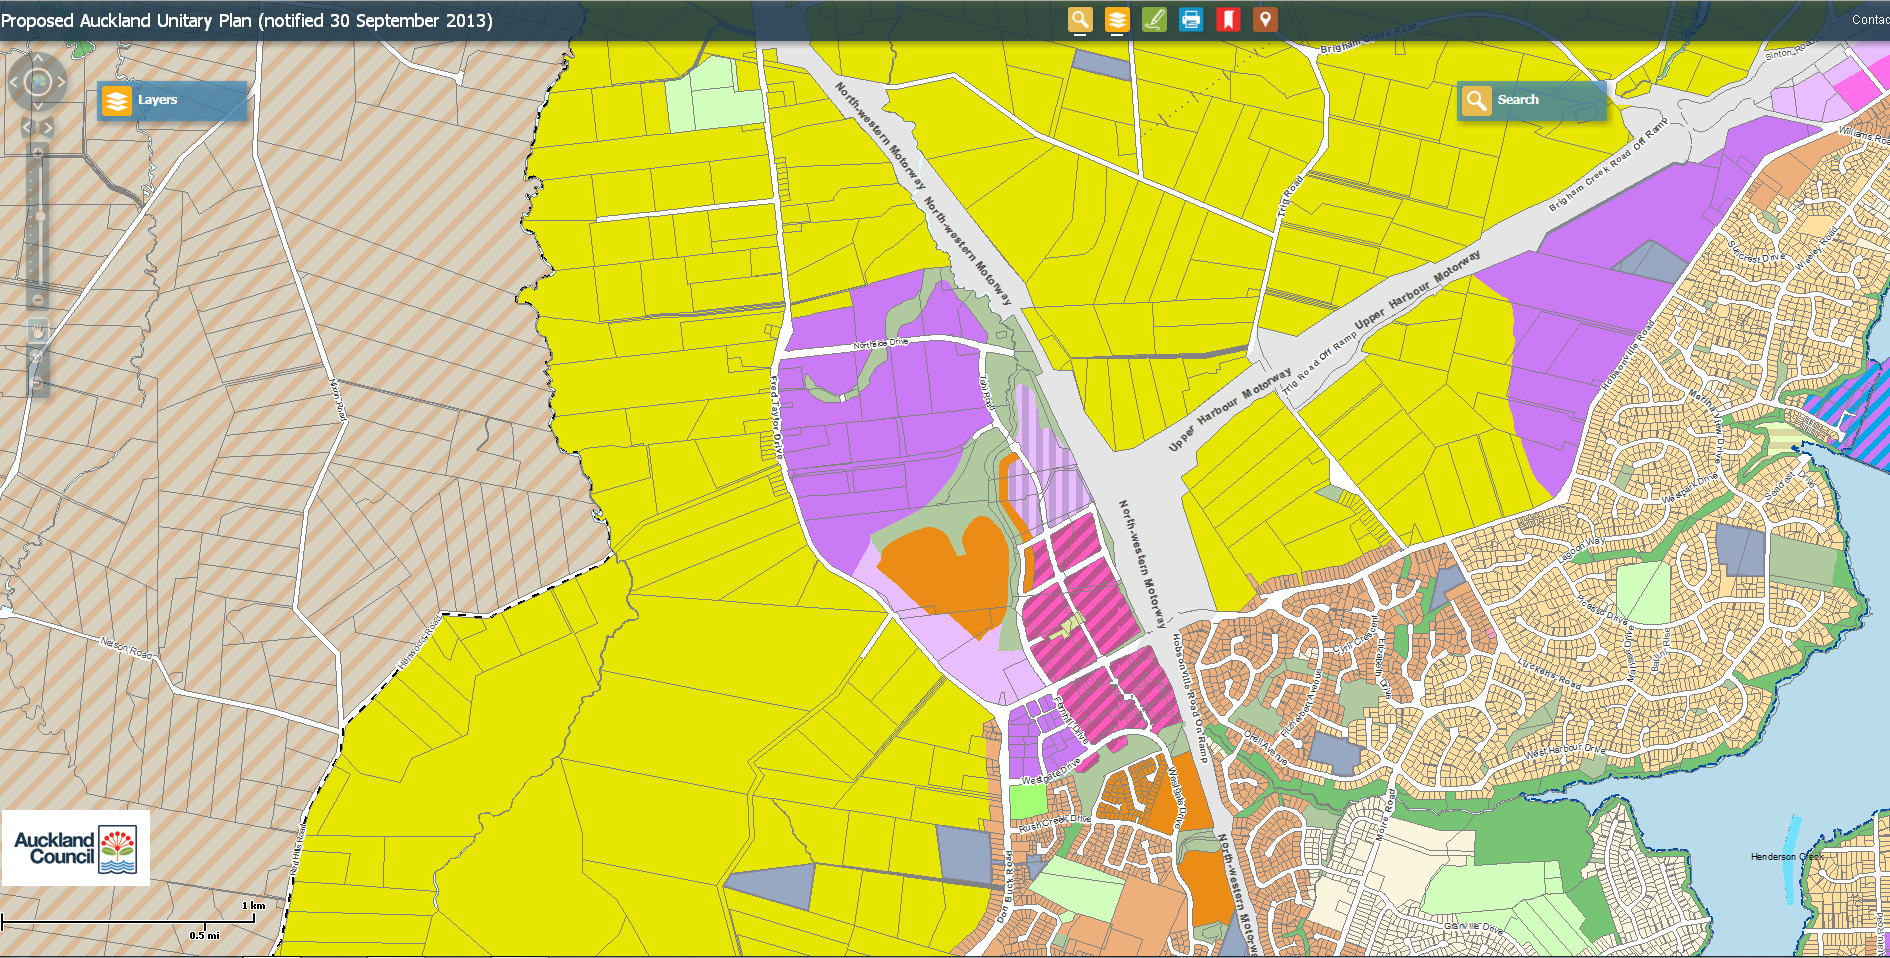
The problem is we are going to face the exact same issues when Auckland continues to develop under the Unitary Plan. The Southern Rural Urban Boundary and Future Urban Zone developments are close to the rail line and bus network so we can predict (with some investment) that we should see some decent public transport mode share in those Greenfield areas. The north west (so Kumeu and so on) that are not served by rail and buses well face the same high private mode share fate as Westgate and Stonefields.
It basically shows we need to get on top of our land-use and transport integrated planning properly. My idea would be developing the South first as it is already linked to quality public transport infrastructure than can be upgraded relatively fast. This would allow the north-west to get its public transport infrastructure up to scratch before we go hammer and tong up there with development. It would also allow to get some decent employment centres developed up in the north-west where as the South already has them with Manukau and the industrial complexes.
Richard Paling Report Transport Patterns in the Auckland Region

