
Planning crucial for these high growth areas
Yesterday Statistics New Zealand released population growth for the full year ending June 30, 2017 for both the nation and the 21 Local Boards in Auckland. Again the upper North Island continues to grow the fastest in nominal population terms while there was a split between South and West Auckland, and the City Centre when it came to types of population growth.
First from Statistics NZ on national population growth by region:
Subnational Population Estimates: At 30 June 2017 (provisional)
Auckland is New Zealand’s fastest-growing region, but Northland and Waikato are close behind, Stats NZ said today.
The populations of both Northland and Waikato grew 2.4 percent over the past year, compared with Auckland’s 2.6 percent.
In the year ended June 2017, New Zealand’s population grew an estimated 100,400. Of this number, 72,300 came from net migration, with more people arriving than leaving the country to live. At the regional level, net migration includes external migration (movements in and out of New Zealand) and internal migration (movements within New Zealand).
“We’re seeing high growth in our big cities, but also in the areas surrounding them, driven by migration,” population statistics senior manager Peter Dolan said.
Auckland’s population grew 42,700 to 1.66 million, with 28,900 more people arriving than leaving.
In the June 2017 year, the West Coast was the only region with a declining population. Its population fell from 33,100 in 2012 to 32,500 in 2016, and decreased further to 32,400 in 2017. This was due to departures exceeding the combined gains from arrivals and natural increase (births less deaths).

In the June 2017 year, half of New Zealand’s population growth was in the 15–39-year age group due to the impact of migration. About two-thirds of the gain from net migration this year was in this age range. The population growth in this age group has affected regional age structures, where five of the regions with the highest net migration either had a stable or decreasing median age in the last year.
Tasman had the highest median age of the 16 regions, at 46.1 years in 2017. In contrast, Auckland had the lowest median age, with half the population under 33.9 years.

……..
The age pyramid shows the difference between a region with an ageing population and a region with a fast growing population currently in its third Baby Boom cycle and offspring of the original baby boomers are in the middle of having their own offspring (notice the budge between 20-35 with a high level from 0-9 relative to those over 55). Couple that new baby boom cycle with the Upper North Island growing the fastest (Otago is as well) and we have Planning and environmental pressures where a large portion of the population already lives.
That said population growth is not even in Auckland either:
Auckland population grows across the boards
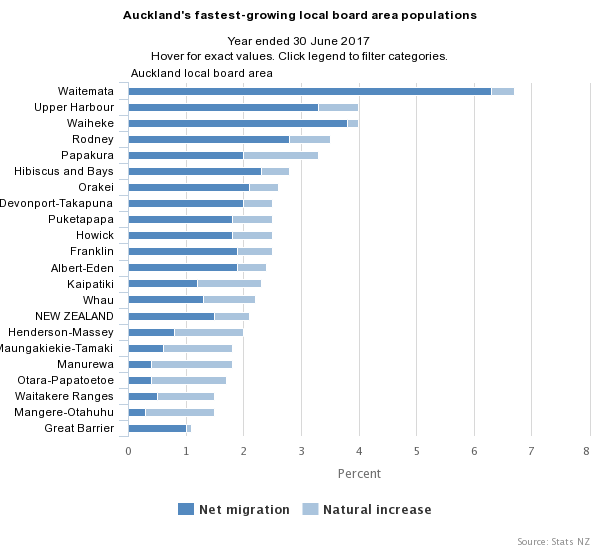
The Auckland region grew 2.6 percent (42,700) in the year ended June 2017, with 6 of its 21 local board areas increasing by more than this, Stats NZ said today.
The population increased in all 21 local board areas within Auckland, with 14 local board areas growing faster than the New Zealand average of 2.1 percent. Waitemata was the fastest-growing local board area, increasing 6.7 percent (6,800). The next fastest-growing areas were: Waiheke (4.1 percent), Upper Harbour (4.0 percent), Rodney (3.4 percent), Papakura (3.3 percent), and Hibiscus and Bays (2.9 percent). Franklin, Orakei, Howick, Devonport-Takapuna, and Puketapapa all increased 2.5 percent. The remaining areas grew between 2.4 and 1.1 percent.
In terms of population numbers, Waitemata grew by 6,800 people. The next-largest gains were in Howick (3,700), Hibisicus and Bays (2,900), and Albert-Eden (2,600). While Waiheke grew the fastest in percent terms after Waitemata, the estimated population only grew by 400.
All 21 local board areas experienced gains from both natural increase (births less deaths) and net migration (arrivals less departures). At the subnational level, net migration includes external migration (movements in and out of New Zealand) and internal migration (movements within New Zealand).
Of the 21 local boards, net migration comprised over half the population growth for 15 areas, and of these areas, 10 had net migration making up over three-quarters of the total gain.
Six local boards had over half their gain from natural increase: Mangere-Otahuhu (82 percent), Manurewa (78 percent), Otara-Papatoetoe (77 percent), Maungakiekie-Tamaki (69 percent), Waitakere Ranges (66 percent), and Henderson-Massey (61 percent).
Source: Statistics New Zealand
—ends—
So the South and West is relying on natural increases (except Papakura) while Waitemata and Upper Harbour had large migration increases. Just to be the exception Papakura had both a high migration and natural increases amount as both new migrants and existing families settle into cheaper housing – and have families.
I somewhat expect natural increases to pick up in the South and West as inequality is reversed under the new administration to the point it will exceed the Replacement Rate of 2.3 (if it has not done so already) Given we are in a third baby boom cycle the rate could hit 2.5 in some areas meaning we are up for some significant growth now and in 25 years time. Hospitals, schools and homes will be needed to be planned for not only now but in time for the next generation as well.
Will be interesting to see how this new Government reacts.


