
Concluding Remarks
And
First Look at Auckland Council’s Spatial Priorities

I am running a series of posts on Auckland’s commuting journeys from home to the work place and back again. The information on Auckland’s commuting journeys is based on the Ministry of Transport commissioned paper done by Richard Paling. You can see the full paper here which based its statistical analysis on the 2001, 2006 and 2013 Censuses: http://www.scribd.com/doc/236566739/Richard-Paling-Report-Transport-Patterns-in-the-Auckland-Region . I do point out those as the material is bases on the Censuses we have limitations insofar as students commuting to and from tertiary institutions were not counted (so some 125,000 students across the institutions at the minimum). So we must bear this in mind when doing out analysis interpretations. An example of this is the Eastern and Southern Rail Lines and who takes them. More on this when I get to the City Centre part of the series.+
| Table B.1 Growth in Population of the Auckland Region 2001-2013 | |||||||||
| Area | Total Resident Population | Total Growth | |||||||
| 2001 | 2006 | 2013 | 2001-2006 | 2006-2013 | |||||
| Total Region | |||||||||
| Total Auckland exc CBD | 1,150,101 | 1,283,598 | 1,384,212 | 11.6% | 7.8% | ||||
| Individual Former Cities or Districts Potentially Impacted by Rail | |||||||||
| Waitakere | 169,569 | 187,281 | 200,826 | 10.4% | 7.2% | ||||
| Auckland City exc CBD | 349,275 | 374,631 | 395,772 | 7.3% | 5.6% | ||||
| Manukau, Papakura & Franklin | 362,478 | 418,446 | 453,378 | 15.4% | 8.3% | ||||
| Combined Areas | 881,322 | 980,358 | 1,049,976 | 11.2% | 7.1% | ||||
A quick recap can be seen at “A First Look at “Journey to Work Patterns in the Auckland Region”” in regard to the transport paper.
—————————————————————————————————
Concluding Remarks
This post brings to an end the ‘Auckland’s Commuting Journey – A Series’ run of posts. Previously the series looked at commuting patters to the City Centre, major employment centres outside of the City Centre, and from key residential centres in Auckland. The Richard Paling Report commissioned by the Ministry of Transport showed for the most part where there is good public transport people will use it. This is shown through private mode share continuously dropping for the most part and public transport mode share going up (both along bus and rail corridors). Places not served well by public transport such as the Airport and Highbrook have higher than regional average private mode share which actually grew on the Census’s period. Furthermore subdivisions built prior to 1990 seemed to have a good public transport usage uptake. Compared to subdivisions built post 1990’s (North Harbour, Flatbush, Dannemora etc) the public transport uptake is relatively low compared to their older subdivision counterparts.
Land use and transport use policy from 1990 until about now (although still some legacy affects are there) was neo-liberal based from the USA where cul-de-sacs and cars were king above all else. Auckland (as well as the USA) have finally seen this and are both retrofitting existing subdivisions to be more public transport and people friendly, while new subdivisions (most likely post Unitary Plan in 2016) should return to our past in being more people friendly and accessible to existing or new public transport infrastructure.
The report also showed South Auckland being an enigma with its commuting patterns. While people and students (who don’t show up in the report and hence why Councillors Brewer and Quax are wrong with their interpretations about the 1.7% rail mode share) do commute to the City Centre or beyond from the South (just take an Eastern Line train between 7am-9am to see) the Auckland’s Commuting Journeys – A Series. #Major non City Centre Employment Centres Overview post illustrated South Auckland largely commuted within itself. This is most likely owing to large industrial complexes, the airport, and Manukau City Centre which are all moderate to large employment centres and those centres serving a diverse socio-economic sector more drawn to these centres than the City Centre would provide.
In the end the report showed three things:
- Not everything is City Centre based or heading to the City Centre as South Auckland would show. This means our transport (and land use planning) needs to be flexible to more cross city commuting and more localised commuting (especially with the South). The Manukau South Rail Link at a cost of about $6m backed up with feeder buses into Wiri would be an example of a quick win allowing a quick (14 minutes from Papakura to Manukau Station) trip from a major residential centre to a major employment centre. In a sense of irony if jobs were provided closer to home owing to good public transport links then the likelihood of cross city commuting decreases thus congestion on roads, buses and trains lessen.
- Where there is public transport people WILL use it so we must continue to stick it out and provide public transport links that work (something the new South Auckland Bus Network should do). Just because 1.7% commute by rail does not mean we should not invest in rail. It shows we should especially as rail is the most efficient form moving people over medium to long distances where as buses (without a bus way) is only good for feeders, short and medium distances.
- Our Landuse/Transport integration policy is still out of whack. Something I will highlight in the Spatial Priorities tie over below
First Look at the 10 Spatial Priorities
Through the Draft Long Term Plan 2015-2025 and no doubt the Auckland Development Committee (which would over see the execution) the Council is targeting its finite City Building resources into these ten spatial priority areas. These SPA’s would over time (so a new set of 10 every 5-10 years) would most likely get dedicated attention and resources funnelled into them as Council embarks on the City Building program. By using Spatial Priority Areas I believe the Council is trying to achieve best bang for buck in areas that at the time would handle specific growth challenges within Auckland. Here is the draft outlook at the first ten spatial priority areas:


They are essentially along rail or bus corridors which means we have a chance of marrying up that land/transport integrated planning. The Rail Corridor Census Area Unit used in the research paper can be seen below
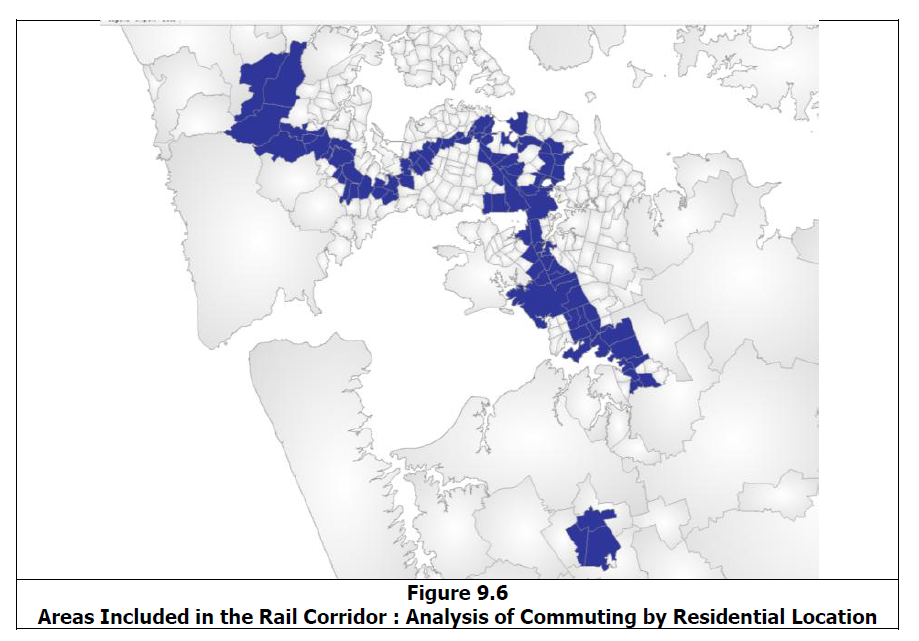
So the first set of Spatial Priorities are focusing on Brownfield developments mainly along the Southern Line and Western Line rail corridors with the City Centre and Manukau City Centre also classed as spatial priorities as well.
I will be interesting to see how Council approaches this and something I will ask the Deputy Mayor who is the Chair of the Auckland Development Committee on Thursday after the Committee meets.
My next series of posts will look at these ten Spatial Priorities as well as the Committee securing up business land for Auckland over the next thirty years.
Richard Paling Report Transport Patterns in the Auckland Region


Ben, this is really helpful stuff.
Problem is, so many of the influential people are looking at this upside down, and saying “how terrible, how do we reverse this trend”, when in fact we need to work out how to best go with the flow.
Anthony Downs nailed it here:
“A Growth Strategy for the Greater Vancouver Region”, 2007:
“……The cost of land poses a key dilemma for urban planners everywhere who want to concentrate jobs together so they can be best served by public transit. Such concentration raises the costs of land near centers; in fact, it would confer a monopoly advantage on landowners who owned such land and could exploit firms trying to locate there. Now firms want to locate elsewhere to cut their land costs.
Planned concentration of jobs in a few centers is not consistent with private ownership and control of land. Some type of collective control over that land would be necessary to prevent monopolistic exploitation of land values. In theory, this could be done with high land taxes in such areas and special zoning rules. But adopting those devices is politically difficult in a free enterprise economy…….
“……A similar but less intensive dilemma concerns land near transit stops, where it would be most efficient to concentrate high-density housing and jobs. That also creates ownership monopolies over such land unless it is specially controlled or taxed. Yet focusing development near transit stops is a key to using more transit…..”
The problem is that “intensification” for whatever reason, including “on PT routes”, will be a victim of its own success – the upzoned locations will quickly inflate so much in price that most potential new residents will be “priced out” and they will be de facto gated communities for yuppies, who will enjoy PT availability at the expense of those paying the subsidies.
IF we have a democratic consensus that we need to save the planet with public transport and PT-oriented urban form, then our “property rights” tradition has to go. We don’t regard Japan as a bunch of commies because the government owns all the real estate served by subway systems, and does what it likes with the development of it, and operates in the rental market as a cost-plus landlord with a social conscience.
In the absence of advocacy that tackles these realities, what advocacy there is has a taint of being no more than useful idiocy for the vested interests in the property that will be most inflated in value by all the planning and public “investment”.
If “property rights” still matter, then our objectives will be better served by ensuring a low, flat urban land rent curve – due to a lack of prohibition on sprawl – and thereby, ensuring that property value inflation where building “up” and transit-oriented development occurs, will at least “price out” a whole lot LESS people. “Build it and they will come” has a lot more chance when what you build are $100,000 townhouses instead of $1,000,000 townhouses. Atlanta is winning “Smart Growth” awards, and the systemically low land cost is a major advantage. The irony is that many city’s planners are so economically illiterate, they regard the $1,000,000 price tag on transit-oriented townhouses as “proof of demand”, rather than proof that their UGB has systemically inflated all land prices inside it, and created an “extractive rent” situation where the more people you can cram in, the more rent you “extract”.
It is only in fringe-unconstrained cities with a low, flat urban land rent curve, that building “up” lowers floor rent in in-demand locations. Theory is being utterly wrongly applied.