
Ironically Airport to Botany has enough density for Light Rail
I was came across an article on Integrated Public Transport, Nantes, France by Heather Allen (2013) and how the city of Nantes (the wider metropolitan area) was able to deliver an urban mobility plan including bus ways and light rail to an urban area with less density than Auckland.
Geography of Nantes and Southern Auckland
Nantes is made up of 24 municipalities (with a single Transport authority like Auckland Transport) that has a population of 590,000 people as of time of the Study. As of 2014 per Wikipedia the population is now 636,000 with the wider area near 1 million. The Density for the Nantes Metropolis is 1,200 people per km2 over an urban area of 523km2
Southern Auckland (Manukau, Howick, Manurewa-Papakura and Franklin Wards) in 2013 had a population roughly the same as Nantes and again similar now in 2017 (with forecast population figures to have the South over 720,000 within a decade). Auckland is 1.75 million as of now spread over 1,300km2 giving us a density of 1,400km2. Given the South would make up around 40% of Auckland’s land area and we know the population is around 636,000 I can extrapolate that the South’s density sits at: 1,223 people/km 2 on an urban area of 520km2 including Pukekohe.
Political structure aside and if we consider our Town Centres the same to the French ‘Commune’ with Papakura Metropolitan Centre the second biggest Commune and Manukau Nantes there we have some similar Urban Geographies in play.
Nantes and its Transport System
Nantes with their unified transport authority follow a lot of aspect our very own Auckland Transport does:
In addition, they have used various ‘push and pull’ measures to dissuade car use, and increase public transport, walking and cycling beyond just infrastructure improvements; These includea reorganization of the institutional set-up at local government level for better ‘joined up thinking’, integrated transport connections and timetabling, bike and car share schemes, car pooling, improving passenger information, removing street parking and promoting park and ride, company employee mobility plans and developing weekly and monthly special ticket rates to mention a few.
They have also been a pioneer in drawing up urban mobility plans and are now on their third one (2010–2020). This framework document sets out transport policy for the next ten years and thematic action plans are elaborated on topics such as public transport, non-motorized transport (soft modes), parking, traffic and road safety and inter- and multimodality aspects.
Nantes’ consistent approach to provide an integrated network of trams, high quality bus services, regular bus services and complementary services has helped to Nantes to some extent manage the growth of private car use, whilst retain a high level of mobility for its citizens and preserve their quality of life. It also highlights the potential for small and medium size cities to still be able to afford high level quality public transport.
Background
A particularity of Nantes Métropole (and possibly one of the reasons for its success) is that they have managed to integrate the decision making agencies in and around the city into one body, Nantes Métropole which exercises various competences and is responsible for highway and public spaces, housing, town planning, land use and development as well as public transport. Nantes Métropole also has the competence for all aspects of organizing public transport. This means the planning, financing, tendering and contracting of operations across all modes; developing and maintaining the rolling stock and infrastructure in cooperation with operators; setting the routes, service frequencies and fares; as well as setting and monitoring quality levels.
Since 2008 there has been only one body responsible for all mobility matters within the conurbation. The departments responsible for the implementation strategy, policy development and operational management were merged, and the new department created is responsible for sustainable mobility rather than transport (changing from a Direction Générale des Déplacements into Aurorité Organisatrice de la Mobilité Durable). It is now responsible for strategy as well as operational management of a whole range of aspects of sustainable mobility, including roads and highway planning, traffic management, traffic and public road management, cycling and parking policies, and management including all off-street parking such as multi-storey car parks, park and rides and other sustainable mobility services such as car-pooling and car sharing.
The transport department is also responsible for the investment in infrastructure, vehicles, facilities and equipment. In today’s world these investments are often made by various operators under different types of contract on behalf of the authority and many services are delegated to private and semi-public providers. After some 30 years of experience Nantes is in a good position to negotiate and manage these contracts (Délégations des Services Publiques).
For public transport operations, at present there is one 7-year long contract, awarded by a call for tenders to a semi-public company of which the management board seats are shared by the Nantes Métropole and Veolia Transdev, a private multinational company responsible for operations.2 The authority finances an investment programme (rolling stock, infrastructure) and provides a financial contribution for operation. The operator is responsible for specific quality levels and to reaching the required ridership level, both levels being set by the authority.
Source: Integrated Public Transport, Nantes, France by Heather Allen (2013). pp. 3-5. Accesses 2018.
- 2: The contract was awarded to Transdev a semi public company but during the term Veolia Transport and Transdev merged and have created one new entity entitle Veolia Transdev. During this process some contracts across France were lost.
Nantes transport authority like Auckland Transport need to establish:
- Urban Mobility Plans or Regional Land Transport Program and Statement of Intents
- Ownership or stewardship of multiple asset types
- Setting of fares
- Traffic Management
- Policies and Planning
Where Auckland Transport differs from Nantes is that Nantes is mandated to focus on sustainable mobility where AT still focuses on transport (and either the flow or bums on seats). This difference between Auckland Transport and Nantes would lead to how Airport to Botany (A2B) Light Rail would be seen very differently using both authorities as comparative examples.

Integrated Public Transport, Nantes, France by Heather Allen (2013)
What did Nantes do with its Transit to encourage ridership?
First of all as of 2010 Nantes had a public transport ridership of 114 million trips per year for a population of 636,000 approximate while as of 2015 that figure hit 132 million. Auckland with 1.75m people can only attract total transit annual ridership numbers of 96 million (as forecast for the 18/19 year). To make it just that more interesting 72m of trips on Nantes’s transit system is by light rail – the highest per capital in France.
While Light Rail has been a major success in Nantes due to the expense of building it without Central Government support (E30m per kilometre while it is $75m per km in New Zealand) Nantes has resorted to building busways. While the busways have been successful they do not attract the same growth nor patronage as light rail has (given light rail still makes up 72% of all transit connections). So we must be careful with Airport to Botany if we choose a bus way given the French example shows patronage and patronage growth is much stronger with LRT!
But back to “What did Nantes do with its Transit to encourage ridership?”
First up some planning that was not City Centre centric:
Public Transport
Over the period 2000–2009, great efforts were made to increase the attractiveness of the collective transport network, and they remain in line with the objectives of the 2000–2015 mobility plan. The total supply in was increased by 22 per cent, with 70 per cent more kilometres on the tram and Busway (express bus running on dedicated or semi dedicated lanes sometimes called a ‘Bus with a High Level of Service’ – BHLS) network. Regular buses were retained for normal services and also to act as feeder services to the Busway.
Public transport infrastructure and the overall quality of the bus network, in particular, was significantly improved in this period:
- 4 ring lines now connect the different districts without the need of passing through the city centre, cutting travel times and avoiding interchanges;
- 3 Express lines offering quick connections at peak hours between suburban towns centres; and
- 7 km of Busway were put in place.
Ridership grew by more than the offer (36 per cent between 2000 and 2009). Today nearly 500,000 (477,300) trips6 are made daily on the network (more than half of them on the four lines of tram and Busway), or 195 trips per year per capita as against 150 in 2000 (plus 30 per cent) – a significant increase. Sixty per cent of them are made on the 3 tramway lines. These figures make Nantes Métropole the second French conurbation in terms of trips per capita (excluding Paris) and it holds first place for the number of trips made by tramway per capita in France.7 Annual growth since 2008 has been in the order of 3–4 per cent. The large numbers of passengers are habitual users and hold annual passes that allow unlimited travel on the network (69,000).
Source: Integrated Public Transport, Nantes, France by Heather Allen (2013). pp. 8. Accesses 2018.
As for Light Rail and Busses:
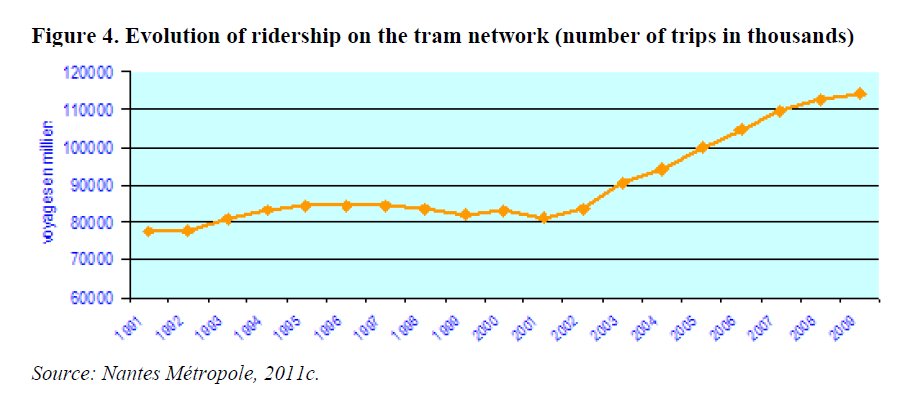
The evolution of ridership in Nantes
Thus the modal share of public transport only grew slightly as the total number of trips grew considerably.
The tram
With a commissioning of the first line (Line 1) as early as 1985, Nantes was the first French city to reintroduce the modern tram, which dramatically changed the city landscape (see pictures below). This first line was then followed by a second line (1992), and in 2000 by a third, for a current total length of 42km. The latest extension was in 2008. A project of linking Line 1 and Line 2 is under development, whose first phase is planned for 2012 (+1.1km).
Line 4 was planned to complement the above network but the public authorities were under severe financial restraints. As tram infrastructure costs between €25–50million per km, it became clear that a solution needed to be found. And the concept of the Busway was born.
In terms of tram operation, the regular frequency on each line is 5 minutes, with increased services at peak times on lines 1 and 2 central sections, to up to 3 or 2’30 min.
The figures for daily ridership are the following:
- Line 1: 115,000.
- Line 2: 85,000.
- Line 3: 74,000.
- The total ridership on the 43km long 3 tram lines accounts for 57 per cent of the total 114 million annual trips made by public transport (note: as of 2015 LRT ridership is now at 52%)
Integrated Public Transport, Nantes, France by Heather Allen (2013). pp. 10. Accesses 2018.
Since the Urban Mobility Plan 2000-2009 went live light saw a good increase in patronage. While the Urban Mobility Plans 2010-2015 and 2015 onward continue to plan for increased ridership the focus turned to short distance commuting in order to cut down localised congestion and the percentage using car mode. The level of success to this so far has been a success in the City Centre but mixed for the outlying sprawl suburbs. For more on LRT Lines 1, 2 and 3 see: Nantes Tramways
Integrated Public Transport, Nantes, France by Heather Allen (2013). pp. 10. Accesses 2018.
Busway
Line 4 was meant to also be light rail but due to the Global Financial Crisis and successive Central Governments not funding light rail (sounds familiar to Auckland until recently) the Nantes Government could not afford nor apparently justify on patronage grounds (see further down on where I have heard this before and backfire majorly) building Line 4 as LRT, so it decided to go for a busway instead.

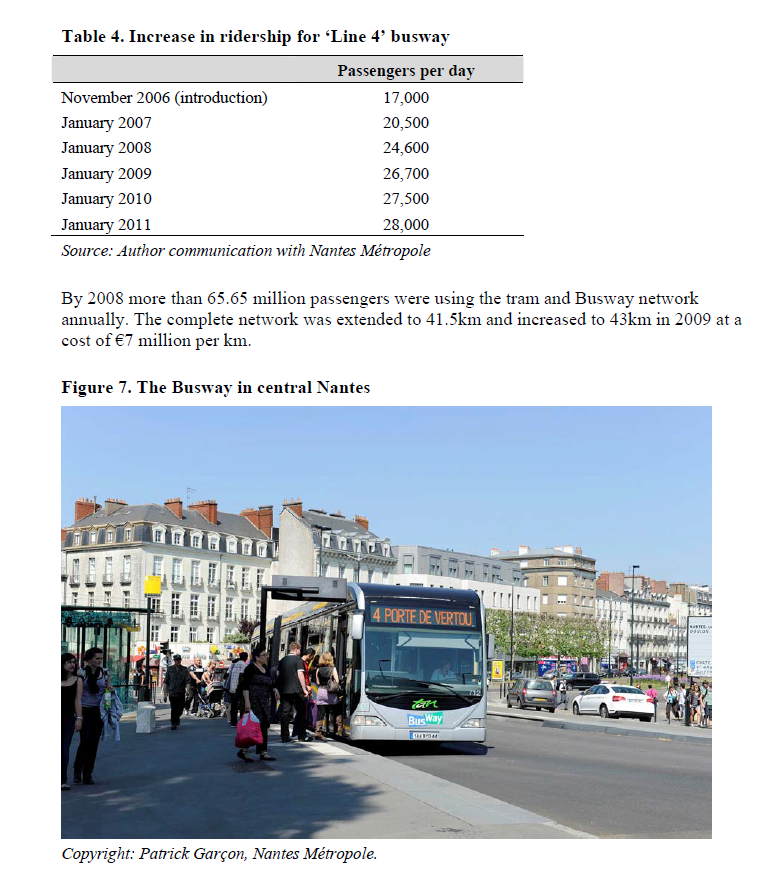
The Busway
To complete the tram network which radiates out from a central hub, a line serving the south eastern part of Nantes was still required. However, based on studies on the expected use, and because central government no longer provided funding for public transit on its own right of way, local officials had to look for a less expensive solution, adapted to the needs of this part of town. The obvious choice was to look at how buses could be made to perform as well as the tramway.
Commissioned in November, 2006, inspired by the success of Bus Rapid Transit in Latin America, the line 48 Busway took many of the elements that made the tramway or metro a success and applied them to a bus system such as:
- All platforms on dedicated lanes with a 20-km average speed.
- Priority at all intersections
- High frequency (3 min at peak times).
- Extended hour service.
- Stops to be like tram stations with real-time information and ticket vending machines.
- Dedicated vehicles: with CNG articulated buses being the preferred choice.
This 7-km long line runs along most of its route on a former road expressway converted into an urban boulevard (see pictures below). Serving 15 stations, it connects the ring road (Porte de Vertou) to the centre of Nantes in less than 20 minutes, and now has a current ridership of 30,000 trips per day (June 2011).9
Other innovative features include the attention to design both of the infrastructure and the vehicles themselves. For a modest increase in overall price, 10 several design features were made improving the perception of quality and aligning the image of the Busway with the successful tram in the eyes of the public. Vehicle livery and the branding of the stations is very distinctive. This attention to detail extended across the whole visual identity of the system and the stations had the look and feel of a tram rather than bus stop. Real time information also helped convey the image of ‘arrive and go’ with little need of a timetable, making taking the bus as easy and convenient as the car.
Ridership improved by 55 per cent over the previous normal city bus service in less than a year and has continued to increase. The accompanying Park and Rides (all under the authority of Nantes Métropole) are at or near capacity indicating that people were making the switch from private to public transport, especially as you need a public transport ticket to swipe at the barriers in order to exit the car parks.
Source: Integrated Public Transport, Nantes, France by Heather Allen (2013). pp. 13. Accesses 2018.
Integrated Public Transport, Nantes, France by Heather Allen (2013). pp. 13. Accesses 2018.
Remember how mentioned about patronage? This is what happened to the Busway:
A victim of its own success, Busway line 4 attracts higher ridership than Semitan expected, pushing the system to saturation. Buses are overcrowded at peak times and nearly full off-peak. Semitan tested the Hess LighTram in November 2009 to eventually increase capacity of the system and relieve overcrowding at peak times. Though that solution wasn’t implemented, Semitan decided to increase passage frequencies to less than 3 minutes at peak times. If saturation recurs, Busway line 4 may be converted into a Tramway line in the future.[2]
Source: Wikipedia
Patronage Modelling Falls Short – VERY SHORT
This is what has me cautious when Airport to Botany should be a bus way first and then maybe light rail in the future. The Nantes Busway was opened in 2006 and by 2009 overcrowding was already happening. Interim measures such as increasing frequency to every three minutes were brought in but by 2012 the Government was already considering making Line 4 light rail as it was envisaged in the first place. As of 2018 the Government was making preparations to convert Line 4 to light rail while expanding all other lines accordingly.

Lessons for Auckland from France?
There are two lessons from Nantes, France for Auckland and in particular Southern Auckland when it comes to transport and changing of land use
First of all transport.
Transport and Urban Development can follow one of two methods:
- Chicken Egg: Do we wait for density to build LRT or
- Do we build LRT to encourage density
It is always the later and this is Nantes does (while Auckland does the former and gets stuck constantly) effectively (and Auckland does not as I just alluded to). Nantes was more than just focused of shifting people from the car to transit (which as the report shows Nantes is in the long game with that one) but also influencing land use via the transit system and its facilities.
Facilities
This is the painstaking detail Nantes when with its Light Rail and Busway system to great succes (to the point as mentioned earlier the Busway became a victim of its own success very quickly and now is to be converted to Light Rail):
- All platforms on dedicated lanes with a 20-km average speed.
- Priority at all intersections
- High frequency (3 min at peak times).
- Extended hour service.
- Stops to be like tram stations with real-time information and ticket vending machines.
- Dedicated vehicles: with CNG articulated buses being the preferred choice.
I believe with the larger stations a full range of small retail offerings is available as well meaning that the stations are not only places we pass through but become destinations within themselves.
Also in Auckland we can only dream of those kind of facilities mentioned above in Nantes.
Remember the Urban Mobility Plans from 2010 onwards is focusing on short distance commuting to mitigate localised congestion especially by car. To do this:
The period 2010–2015
The new Urban Mobility Plan however marks an important turning point, with two complementary directions: the joint development of mobility and urban planning policies to build the city of short distances organized around denser urban centres and the planning of public spaces that are calm and tranquil.
The new plan sets new targets, particularly in terms of modal share (with an emphasis on alternative modes: 12 per cent modal share for cycling and 30 per cent for walking by 2030, see Table 3), illustrates the conurbation’s strong will to encourage and support behaviour changes for the rise of alternatives to individual motorized transport.
Source: Integrated Public Transport, Nantes, France by Heather Allen (2013). pp.7. Accesses 2018.
The final draft of the third plan was politically approved in October 2010, after a long period of consultation with the main local stakeholders: surrounding local authorities, associations, professionals, the development council, and most specifically the results of a citizens’ workshop. This workshop involved 18 volunteers who were trained and worked together during 3 weekends in order to present concrete propositions to the politicians to be taken into account in the reflection over the next urban mobility plan. This work contributed much to feed the debate over the role of pedestrians in the city and more broadly speaking over the pacification of car traffic in urban areas. The final approval of the Urban Mobility Plan takes place after consultation with key stakeholders and a public inquiry.
The new Urban Mobility Plan however marks an important turning point, with two complementary directions: the joint development of mobility and urban planning policies to build the city of short distances organized around denser urban centres and the planning of public spaces that are calm and tranquil.
Transport, mobility and urban planning policies to build a city of of short distance (commuting) around denser urban centres and planning of public spaces… The public spaces part is on our Government Policy Statement 2018 which Auckland Transport and NZTA are meant to follow.

The rest is to encourage better urban development and spaces also in the GPS:

Given Nantes follows the “Do we build LRT to encourage density” method then Nantes follows our own GPS master policy. Given NZTA and Auckland Transport think City Centre to Mangere and Airport to Botany is little more than a transit line to move people around thus ” Do we wait for density to build LRT” both of our agencies are not following the GPS at all.
Nantes through their Urban Mobility Plans recognise what their transit backed up with cycling and walking is designed to do. It is to encourage greater transit modal share (that is reduce car mode share) which encourages greater density around those transit areas THUS less need for cars while also getting better public spaces (so wins all around). In short if I was to boil down my entire post into a single line:
Nantes uses its transit system to build communities!

Where has this been heard before? Probably here: The Southern Airport Line – More than a Light Rail Line – A Community and City Builder Too!,
Here where I delve into Airport to Botany Light Rail not only community building but also being viable due to it linking up Metropolitan Centres (that everyone forgets about): UPDATED: Urban Geography Thoughts on City Centre to Airport Light Rail, and Airport to Botany Rapid Transit
Here given A2B has a large range of Mixed Use Zones compared to City Centre to Mangere thus the opportunity to follow Nantes in building tight compact and denser urban centres is more prevalent with: A2B: Affordable Housing – A Presentation on Typology and How We Can Not Forget Transport in the Affordability Equation
Remembering that:
Access to Centres and Housing Affordability –Why the Heterogeneous Zone is Promoted
- Housing affordability is more than the price or the rent of the house
- The price of the commute (work or leisure) is often left out in determining housing affordability
- Homogeneous use zones (no matter who owns the land) does not promote housing affordability owing to access to employment and recreation
- The Heterogeneous Zone (aka the Centre or Mixed Use Zone) promotes better housing affordability due to close proximity to either employment or leisure
- Land: Public Land should be held onto with development BUT the Mixed Use and mixed types should still be followed
Here in regards to it is more than bums on seats: Light Rail and Urban Transformation – A Video from the Building Nations 2018 Symposium. I Have Questions.
More on A2B being Light Rail especially around denser urban places within close proximity to an LRT station: The Southern Airport Line and Transit Orientated Developments. Rethinking Transit and Developments in Auckland
Finally here when it comes to the environment: We are doing the Airport Lines All Wrong Part 2: Where is South Auckland’s Green Line?
Of interest Nantes Line 3 (LRT) is an actual green line:

By IngolfBLN – Nantes – Tramway – Ligne 3 – Orvault, CC BY-SA 2.0, https://commons.wikimedia.org/w/index.php?curid=22010596
Concluding remarks
Nantes Metropolis is a similar area with similar population, similar population density and similar urban geographic layout with Southern Auckland. Both also have a unified transport authority. But this is where the similarities end.
Nantes through their Urban Mobility Plan believe in building Light Rail (and other transit) to encourage density and small distance commuting (thus removing localised congestion where most car trips are made) and have done so through building Lines 1-4, the Chronobus and revamping their feeder busses. Nantes also believe in the mixed use heterogeneous zone to encourage all this as well
Auckland on the other hand still follows the wait for density before we build Light Rail or lets build Light Rail through areas mainly of single use residential zones despite the rich or rather VERY RICH opportunities building Light Rail through an area that has mixed use zoning and would do great in encouraging both density and getting people out of their cars!
Nantes also learned very quickly the consequences of building a busway in a rapidly growing area only for said busway being overcrowded within three years of operation and now 12 years later it will be converted to Light Rail.
I can assure you given the growth of both employment AND residents in Southern Auckland particularly along the Airport to Botany corridor (in itself a good thing to relieve pressure off the Southern Line and Southern Motorway corridors) a bus way for Airport to Botany would meet the same fate as the Line 4 busway in Nantes.
The beauty of Airport to Botany as Light Rail is that like Nantes feeder busses feed perfectly into the the line:

Finally – Airport to Botany is already green with grass medians, why would you turn that into tarmac for busses? You wouldnt!

The full report from Heather Allen can be read here:

